Rで解析:メトロポリタン美術館のコレクションから閃いた!!カラーパレット「MetBrewer」パッケージ
メトロポリタン美術館のコレクションから刺激を受けて作られたカラーパレットを収録したパッケージの紹介です。葛飾北斎(パレット名:Hokusai1, Hokusai2, Hokusai3)や歌川広重(パレット名:Hiroshige)など50種類のパレットが収録されています。趣きがある図が作成できるかもしれません。
収録カラーパレットは実行コマンドとRmdファイルで紹介します。実行前に「パッケージのインストール」のコマンドを実行してください。なお、実行はRStudioがおすすめです。
パッケージのバージョンは0.1.0。実行コマンドはRStudioのRStudio Desktop 2021.09.2+382、windows 11のR version 4.1.2で確認しています。
<おすすめのRに関する書籍です>
RStudioではじめるRプログラミング入門 | ギャレット・グロ-ルマンド, 大橋真也, 長尾高弘
Amazonでギャレット・グロ-ルマンド, 大橋真也, 長尾高弘のRStudioではじめるRプログラミング入門。アマゾンならポイント還元本が多数。
パッケージのインストール
下記コマンドを実行してください。
install.packages("MetBrewer")
install.packages("tidyverse")
install.packages("flexdashboard")
install.packages("DT")
スポンサーリンク
実行コマンドとRmdファイル
詳細はコマンド、Rmdファイル(エンコード:UTF-8)、パッケージヘルプを確認してください。
---
title: "MetBrewerパッケージ"
output:
flexdashboard::flex_dashboard:
orientation: columns
social: menu
source_code: embed
runtime: shiny
---
```{r global, include=FALSE}
#必要パッケージの読み込み
library("MetBrewer")
library("tidyverse")
library("flexdashboard")
library("DT")
###データ例の作成#####
n <- 100
TestData <- data.frame("Group" = sample(paste0("Group", 1:5), n, replace = TRUE),
"Data1" = sample(1:10, n, replace = TRUE),
"Data2" = sample(LETTERS[1:24], n, replace = TRUE))
########
#「MetBrewer」パッケージ:カラーパレット名:50種類
GgSColName <- c("Austria", "Cassatt1", "Cassatt2", "Cross", "Degas", "Derain", "Egypt", "Gauguin", "Greek", "Hiroshige", "Hokusai1", "Hokusai2", "Hokusai3", "Homer1", "Homer2", "Ingres", "Isfahan1", "Isfahan2", "Juarez", "Klimt", "Lakota", "Manet", "Monet", "Moreau", "Morgenstern", "Nattier", "Navajo", "NewKingdom", "Nizami", "OKeeffe1", "OKeeffe2", "Peru1", "Peru2", "Pillement", "Pissaro", "Redon", "Renoir", "Robert", "Signac", "Stevens", "Tara", "Thomas", "Tiepolo", "Troy", "Tsimshian", "VanGogh1", "VanGogh2", "VanGogh3", "Veronese", "Wissing")
```
Column {data-width=500}
-------------------------------------
```{r}
selectInput('Colpal', 'Select Color Palette Name', GgSColName)
```
###収録カラーパレット:50種類
```{r}
renderDataTable({
ColCodeData <- data.frame("Color_Code" = as.character(met.brewer(input$Colpal)),
"Color" = "")
datatable(ColCodeData, rownames = FALSE,
options = list(pageLength = 10, lengthMenu = c(20, 40, 100))) %>%
formatStyle("Color", valueColumns = "Color_Code",
backgroundColor = styleEqual(ColCodeData[, 1], ColCodeData[, 1]))
})
```
Column {data-width=500}
-------------------------------------
###ggplot2:colorに適応
```{r}
renderPlot({
ggplot(TestData,
aes(x = Data1, y = Data2, col = Group)) +
geom_point(size = 10) +
theme_bw() +
scale_color_manual(values = met.brewer(input$Colpal)) +
labs(title = paste0("パレット名:", input$Colpal)) +
theme_bw(base_family = "Yu Gothic")
})
```
###ggplot2:fillに適応
```{r}
renderPlot({
ggplot(TestData,
aes(x = Data2, fill = Group)) +
geom_bar(stat = "count") + theme_bw() +
scale_fill_manual(values = met.brewer(input$Colpal)) +
labs(title = paste0("パレット名:", input$Colpal)) +
theme_bw(base_family = "Yu Gothic")
})
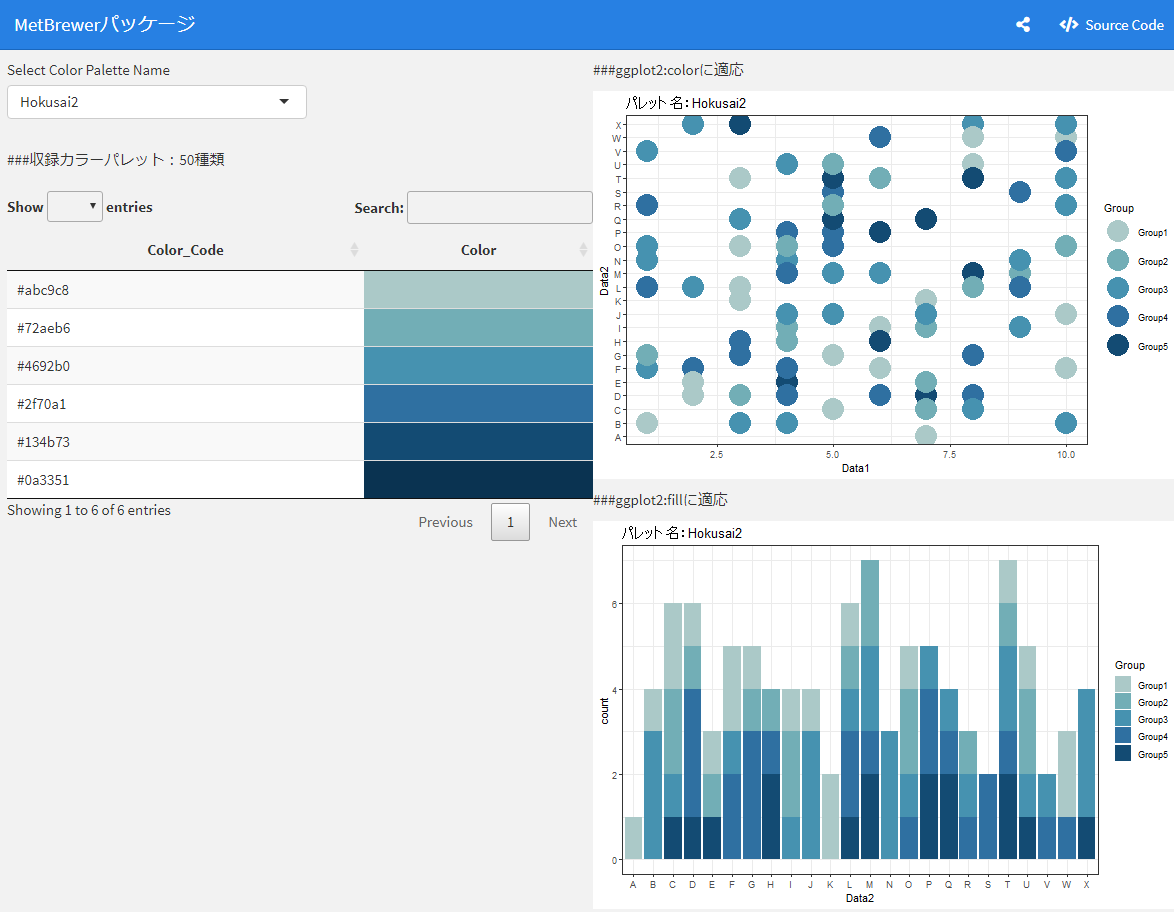
```出力例
葛飾北斎の絵が思い出されるパレットです。
少しでも、あなたの解析が楽になりますように!!
スポンサーリンク