statics

スポンサーリンク
RAnalytics

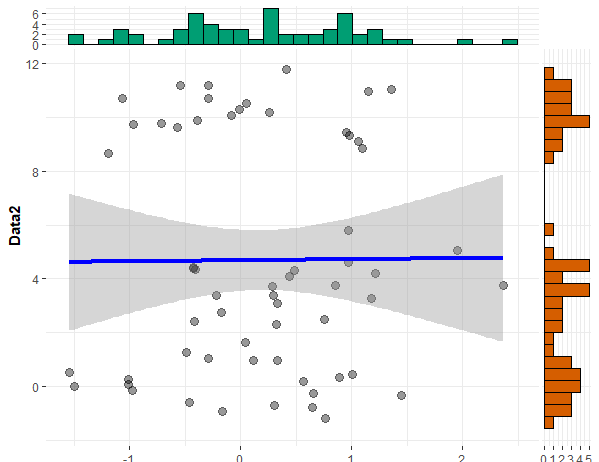
Analysis in R: Plot statistics with ggplot2! The “ggstatsplot” package

This is an introduction to a package that is useful for plotting statistics together in ggplot2. The...
RAnalytics

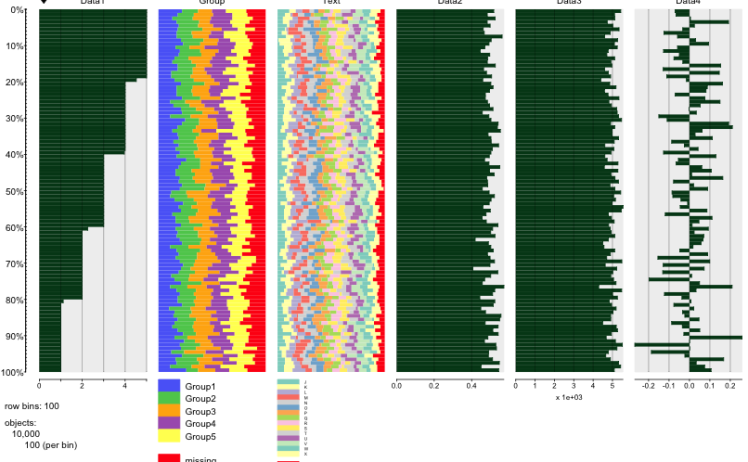
Analysis in R: Examine all the characteristics of your data! The “tabplot” package

Introducing the "tabplot" package, which provides a graphical representation of the data in its enti...
RAnalytics

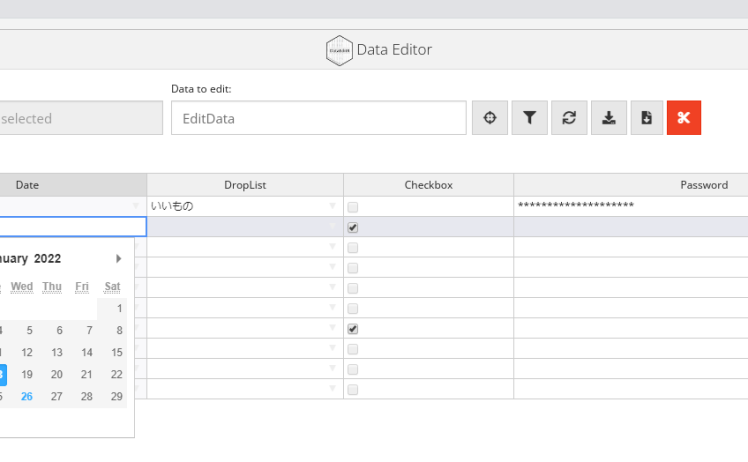
Analysis in R: “DataEditR package for interactively editing data in RStudio

This is an introduction to a package that allows you to edit data interactively in RStudio. Note tha...
RAnalytics

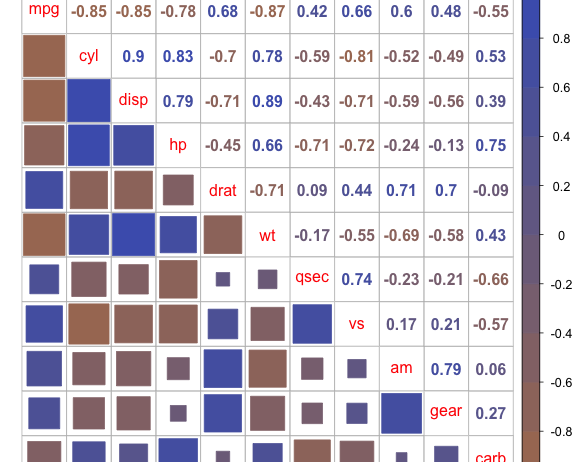
Analysis in R: Useful for expressing multivariable relationships! The “corrplot” package

This is an introduction to a package that is useful for expressing multivariable relationships. For ...
RAnalytics

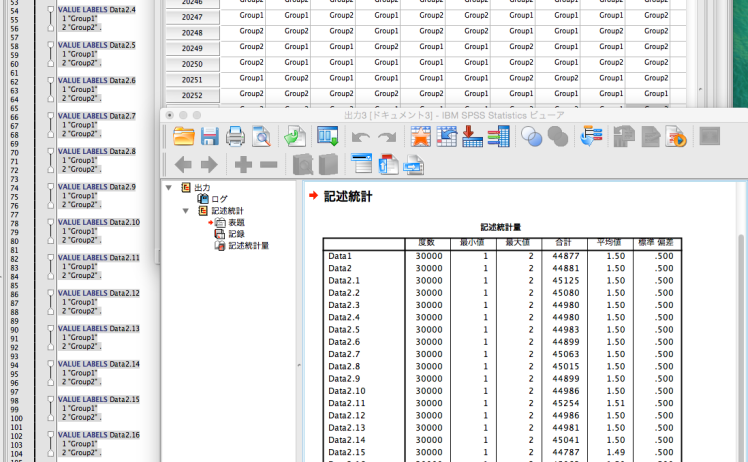
Analysis in R: Create an SPSS syntax to reproduce your analysis data! Introduction to the ‘descr’ package.

Descriptive statistics is the important task of summarising data, calculating statistics and underst...
RAnalytics

Analysis in R: Easy to create color palettes and manipulate continuous and discrete scales “scales” package

This article introduces the scales package, which makes it easy to create color palettes, manage str...
RAnalytics

Analysis in R: Examples of commands for extracting data about vectors

This is a sample command for extracting data from vectors. This is a rudimentary introduction to the...
RAnalytics

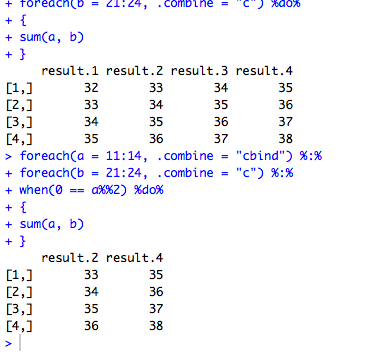
Analysis in R: “foreach” package useful for iterative processing

The "for" and "apply" commands are useful for iterative processing, but they are sometimes inflexibl...
RAnalytics

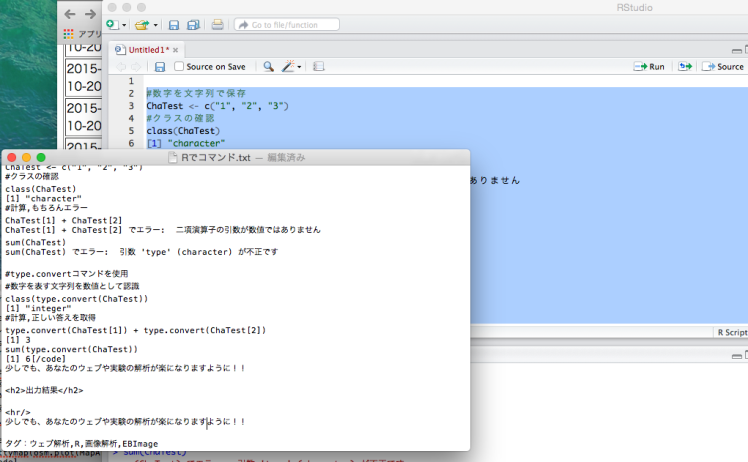
Analysis in R: Detecting strings as numbers. The “type.convert” command

When manipulating data, the data may change from numbers to letters. A shortcut to the solution is t...
RAnalytics

Analysis in R: Introduction to Probability Distribution Commands

This section introduces commands for the normal, binomial, chi-square, and F distributions. Command ...
スポンサーリンク