からだにいいもの
 Analysis in R: Can also be used for process control. Creation of Gantt charts ‘PlotPrjNetworks’ package.
Creating Gantt charts is surprisingly difficult, but the ”PlotPrjNetworks” package makes it easy. Complex Gantt charts can be created. Please give it a try.
Package version is 1.0.0. Checked with R version 4.2.2.
<おすすめのRに関する書籍です>

Rクックブック 第2版 | J.D.Long, Paul Teetor, 大橋真也
「これをやりたい」から引ける約300本のレシピ集。手元に置いて困ったときに開く、リファレンス的な使い方が合う一冊。
Install Package
Run the following command.
#Install Package
install.packages("PlotPrjNetworks")
スポンサーリンク
Example
See the command and package help for details.
#Loading the library

library("PlotPrjNetworks")

#Create project data
#Process name, start and end date data required
TasksData <- data.frame(task = paste0("Test", 1:10),
                        start = c("2015-07-05", "2015-08-05", "2015-10-05",
                                  "2016-01-05", "2016-03-18", "2016-04-05",
                                  "2016-07-05", "2016-09-05", "2017-01-05",
                                  "2017-03-18"),
                        end = c("2015-08-01", "2015-9-05", "2016-01-05",
                                "2016-03-18", "2016-04-18", "2016-07-05",
                                "2016-9-05", "2017-01-05", "2017-03-18",
                                "2017-04-18"))

#Project management data
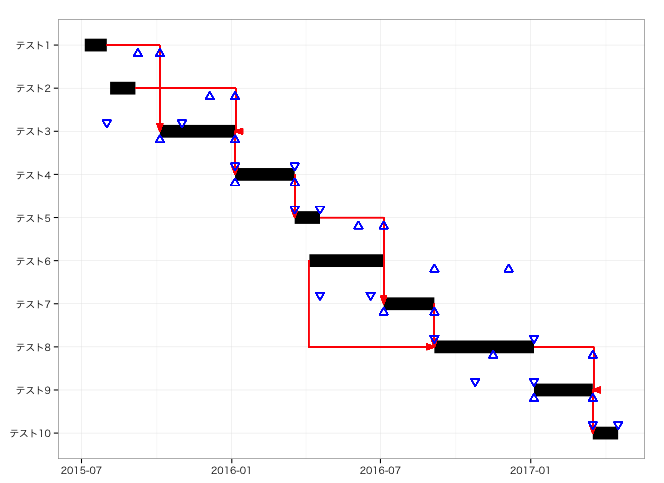
#form,to: relationship between processes, type: method of joining lines;
#F: from the "end", S: from the "start", delay: setting of construction time delay
#The upper and lower triangular symbols shown
#for each process indicate the shortest time at
#the top and the delay tolerance at the bottom
InfoData <- data.frame(from = c(1, 2, 3, 4, 5, 6, 7, 8, 9),
                          to = c(3, 3, 4, 5, 7, 8, 8, 9, 10),
                          type = c("FS", "FF", "FS", "FS", "FS", "SS", "FS", "FF", "FS"),
                          delay = c(0, 0, 0, 0, 0, 0, 0, 0, 0))

#Plot
GanttChart(TasksData, InfoData)
Output Example
少しでも、あなたの解析が楽になりますように!!
![改訂2版 RユーザのためのRStudio[実践]入門〜tidyverseによるモダンな分析フローの世界 | 松村優哉, 湯谷啓明, 紀ノ定保礼, 前田和寛](https://images-na.ssl-images-amazon.com/images/P/4297121700.09.LZZZZZZZ.jpg)
スポンサーリンク