からだにいいもの
 Analysis in R: Repeat the process with the element name in the data frame.
While row-by-row or column-by-column processing can be handled with the “apply”, “lapply”, or “supply” commands, there are times when you may want to iterate through the names of items in a data frame.

For example, data for several items observed several times at different times.
“Item X_1, Item X_2, Item X_3, Item Y_1, Item Y_2, Item Y_3…”
Here is an example of code that processes data item by item.
<おすすめのRに関する書籍です>

 www.amazon.co.jp
Packages required to run the code
Run the following command.
install.packages(c("ggplot2", "grid", "reshape"))Points to be processed item by item
The format of SampleData is a data frame; SampleData should be modified as required.
###Prepare for iterative processing and label vector creation########
CNAnaData <- t(as.data.frame(strsplit(colnames(SampleData),"_")))[, 1] #Get the name of the column identified by an underscore.
StartCol <- (which( duplicated(CNAnaData) == TRUE, arr.ind = TRUE)[1]) - 1 #Get Start Row
RangeCol <- unique(rle(CNAnaData)[[1]][rle(CNAnaData)[[1]] != 1]) #Get End Column
LabName <- unique(CNAnaData) #Get labels
########

###Set iteration vectors########
StartColSelect <- seq(StartCol, (ncol(SampleData)), by = RangeCol) #Creation of measured start vectors
EndColSelect <- seq(StartCol + (RangeCol - 1), (ncol(SampleData)), by = RangeCol) #Creation of measured end vectors
########
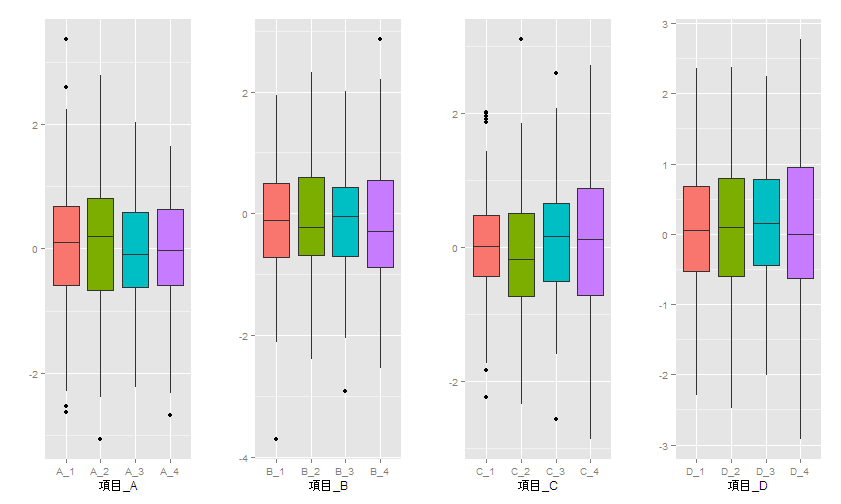
Reference example: Code to plot BoxPlot by element name
The following code will plot a box plot for each element name.
As the ID is not specified in the merge function, “Use as id variables” is displayed, but this is not a problem.
library("ggplot2")
library("grid") #Need to adjust layout
library("reshape") #Required to use Meld

###Creation of sample data#####
Item <- 4 #Set number of items, 4 for now
Rep <- 4 #Number of repetitions per item, 4 for now
DataVol <- 100 #Set the number of columns, 100 for now
ColNames <- NULL

#Creating a column name
for (i in seq(Item)){
  name <- paste(LETTERS[i], "_", 1:Rep, sep="")
  ColNames <- c(ColNames, name)
}

SampleData <- as.data.frame(matrix(rnorm(DataVol * Item * Rep), nr = DataVol, nc = Item * Rep))
colnames(SampleData) <- ColNames #Set column name
########

###Prepare for iterative processing and label vector creation########
CNAnaData <- t(as.data.frame(strsplit(colnames(SampleData),"_")))[, 1]
StartCol <- (which( duplicated(CNAnaData) == TRUE, arr.ind = TRUE)[1]) - 1
RangeCol <- unique(rle(CNAnaData)[[1]][rle(CNAnaData)[[1]] != 1])
LabName <- unique(CNAnaData)
########

###Set iteration vectors########
StartColSelect <- seq(StartCol, (ncol(SampleData)), by = RangeCol)
EndColSelect <- seq(StartCol + (RangeCol - 1), (ncol(SampleData)), by = RangeCol)
########

###Layout Settings#####
grid.newpage()
gl <- grid.layout(nrow = 1, ncol = 4) #Layout divided by 1*4
pushViewport(viewport(layout=gl))
#grid.show.layout(gl) #Confirmation of layout
########

###Repeated plots with repeated processing vectors#####

for(n in seq(StartColSelect)){

  meltAnaData <- melt(SampleData[, StartColSelect[n]:EndColSelect[n]])

  ###ggplot2#####
  plotdata <- ggplot(meltAnaData, aes(x = meltAnaData[, 1],
                                         y = meltAnaData[, 2],
                                         fill = meltAnaData[, 1]))
  PlotData <- plotdata +
    geom_boxplot(size = 0.1, show_guide = FALSE) +
    labs(x = paste("Item_", LabName[n], sep = ""), y = "")

  print(PlotData, vp = viewport(layout.pos.col = n))
}
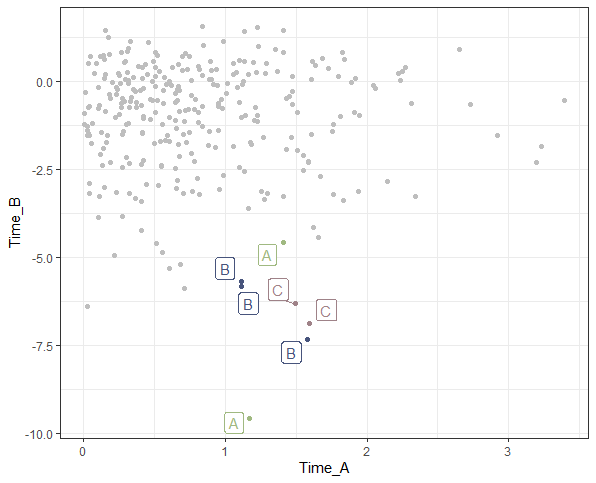
Output Examples
As the “rnorm” command is used to create the data, the data changes each time.
I hope this makes your analysis a little easier !!