からだにいいもの
 Analysis in R: Adding graphs to your Heat Map is easy! The “superheat” package
This package provides a heat map of the characteristics of the data. You can add a box plot or bar chart in the y-axis direction.
Package version is 0.1. Checked with R version 4.2.2.
<おすすめのRに関する書籍です>

東京大学のデータサイエンティスト育成講座 ~Pythonで手を動かして学ぶデ―タ分析~
データ分析の一連の流れを手を動かして学ぶ定番書。ただしコードはRではなくPython中心なので、その点は注意。
 www.amazon.co.jp
Install Package
Run the following command.。
#Install Package
install.packages("devtools")
devtools::install_github("rlbarter/superheat")
スポンサーリンク
Example
See the command and package help for details.
#Loading the library
library("superheat")

#Install the "scales" package if it is not already present
if(!require("scales", quietly = TRUE)){
  install.packages("scales");require("scales")
}

###Creating Data#####
n <- 30
TestData <- data.frame(Group = sample(paste0("Group", 1:5), n, replace = TRUE),
                       Data1 = rnorm(n),
                       Data2 = rnorm(n),
                       Data3 = rnorm(n) + rnorm(n) + rnorm(n))
#######

#Set colors:"scales" package
x <- seq(0, 1, length = 5)
ColData <- seq_gradient_pal(c("#e1e6ea", "#505457", "#4b61ba", "#a87963",
                                       "#d9bb9c", "#756c6d", "#807765", "#ad8a80"))(x)

#Plot HeatMap:superheat command
#x-axis setting:X option
#y-axis setting:yr option
#y-axis grouping:membership.rows option
#y-Axis Auxiliary Plot Contents:yr.plot.type option;
#scatter","bar","boxplot","scattersmooth","smooth","scatterline","line"
#Heatmap color settings:heat.pal option
#y-axis labels color setting:left.label.pal option
#x-axis labels size:bottom.label.text.size option
#x-axis angle:bottom.label.text.angle option
#y-axis labels size:left.label.text.size option
#y-axis angle:left.label.text.angle option
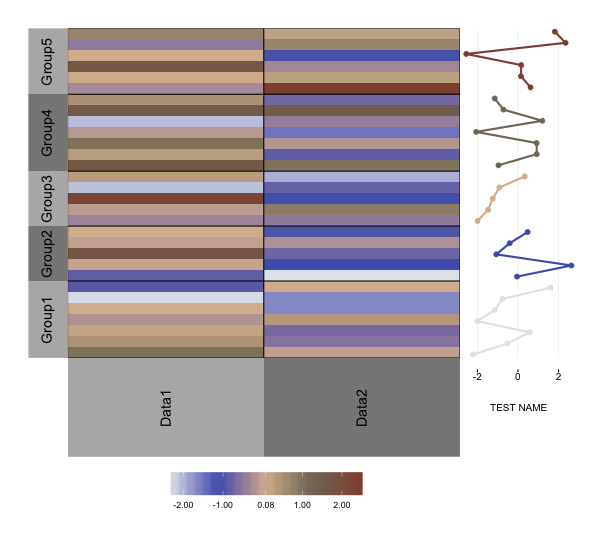
superheat(X = TestData[, 2:3],
          yr = TestData[, 4],
          membership.rows = TestData[, 1],
          yr.axis.name = "TEST NAME",
          yr.plot.type = "scatterline",
          heat.pal = ColData,
          left.label.col = ColData,
          bottom.label.text.size = 0.3,
          bottom.label.text.angle = 90,
          left.label.text.size = 5,
          left.label.text.angle = NULL
          )
Output Example
・superheat command
I hope this makes your analysis a little easier !!

スポンサーリンク