からだにいいもの
 Rで解析:「raster」パッケージのコマンド紹介
rasterパッケージは「セル(ドット)の並びでデータを表現する」多くのコマンドが収録されています。パッケージの中から、日常用途に使いそうなコマンドをまとめました。
パッケージのバージョンは3.5-15。実行コマンドはwindows 11のR version 4.1.3で確認しています。
<おすすめのRに関する書籍です>

超入門! Rでできるビジュアル統計学 学会・論文発表に役立つデータ可視化マニュアル
学会発表や論文の図表づくりに寄せた実践書。伝わるグラフをRで作るための手順をまとめている。
 www.amazon.co.jp
パッケージのインストール
下記コマンドを実行してください。
#パッケージのインストール
install.packages("raster")
スポンサーリンク
実行コマンド
詳細はコマンド、パッケージヘルプを確認してください。
#パッケージの読み込み
library("raster")

###簡単な例#####
#rasterレイヤーの作成:rasterコマンド
x <- raster()
##構成の確認
#データは空です
x
class       : RasterLayer
dimensions  : 180, 360, 64800  (nrow, ncol, ncell)
resolution  : 1, 1  (x, y)
extent      : -180, 180, -90, 90  (xmin, xmax, ymin, ymax)
coord. ref. : +proj=longlat +datum=WGS84 +ellps=WGS84 +towgs84=0,0,0

#ピクセルサイズの変更:resコマンド
#値を大きくすると画質が荒くなります
#レイヤーサイズが変わります
res(x) <- 30
x
class       : RasterLayer
dimensions  : 6, 12, 72  (nrow, ncol, ncell)
resolution  : 30, 30  (x, y)
extent      : -180, 180, -90, 90  (xmin, xmax, ymin, ymax)
coord. ref. : +proj=longlat +datum=WGS84 +ellps=WGS84 +towgs84=0,0,0

#レイヤーにデータを代入:valuesコマンド
#data source,names,values
values(x) <- matrix(sample(1:300, 72, replace = TRUE), 6, 12)
x
class       : RasterLayer
dimensions  : 6, 12, 72  (nrow, ncol, ncell)
resolution  : 30, 30  (x, y)
extent      : -180, 180, -90, 90  (xmin, xmax, ymin, ymax)
coord. ref. : +proj=longlat +datum=WGS84 +ellps=WGS84 +towgs84=0,0,0
data source : in memory
names       : layer
values      : 5, 298  (min, max)

#データの計算コマンド:calcコマンド
#コマンドを実行すると新規にラスターデータが作成されます
calc(x, function(x) { x * 2})
class       : RasterLayer
dimensions  : 6, 12, 72  (nrow, ncol, ncell)
resolution  : 30, 30  (x, y)
extent      : -180, 180, -90, 90  (xmin, xmax, ymin, ymax)
coord. ref. : +proj=longlat +datum=WGS84 +ellps=WGS84 +towgs84=0,0,0
data source : in memory
names       : layer
values      : 10, 596  (min, max)

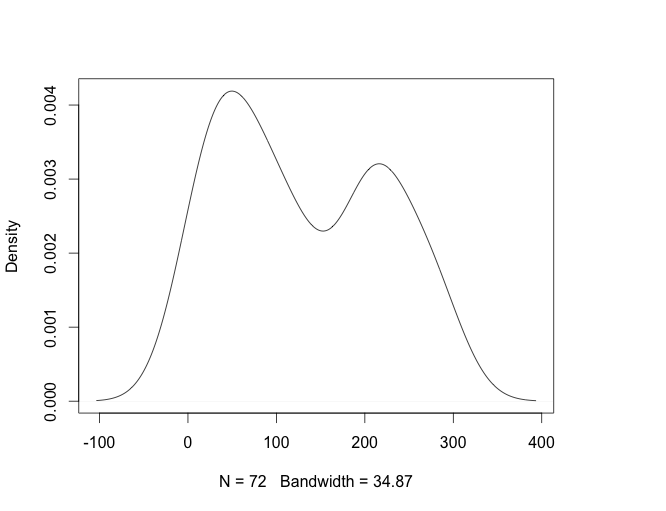
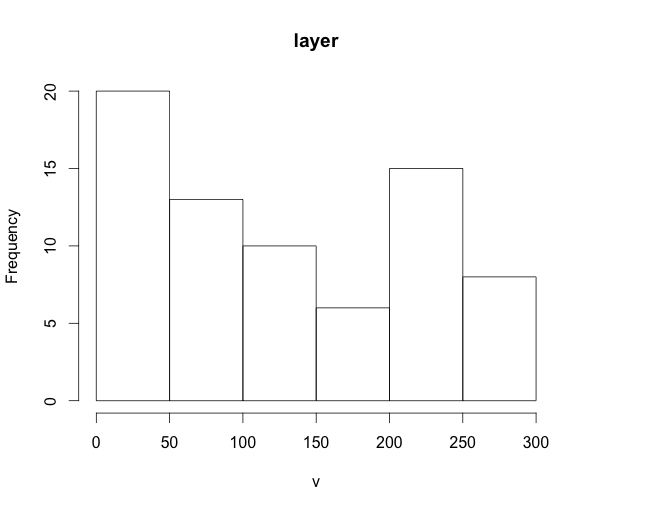
#データの分布を確認:densty,histコマンド
density(x)
hist(x)

#特定セルのデータを取得する方法
#RasterLayer[i]で指定:iはセル番号
x[23]
120
#RasterLayer[rowNo, ColNo]
x[2, 11]
120

#x,yのデータ範囲からセル番号を取得:cellFromXYコマンド
#データをプロットすると理解しやすいです
cellFromXY(x, c(120, 50))
[1] 23

#x軸のデータ範囲から列番号を取得:colFromXコマンド
colFromX(x, 120)
[1] 11

#y軸のデータ範囲から列番号を取得:rowFromYコマンド
rowFromY(x, 50)
[1] 2

#データ範囲に含まれるセルの値を取得:fourCellsFromXYコマンド
fourCellsFromXY(x, cbind(c(-150, 150), c(-50, 50)))
     [,1] [,2] [,3] [,4]
[1,]   50   62   61   49
[2,]   24   12   11   23

#行番号を指定してセルの番号を取得:cellFromRowコマンド
cellFromRow(x, 2)
[1] 13 14 15 16 17 18 19 20 21 22 23 24

#列番号を指定してセルの番号を取得:cellFromColコマンド
cellFromCol(x, 11)
[1] 11 23 35 47 59 71

#行列を指定してセルの番号を取得:cellFromRowColコマンド
cellFromRowCol(x, 2, 11)
[1] 23

#x, y軸の範囲を変更:extent
extent(x) <- c(0, 1, 0, 1)
x
class       : RasterLayer
dimensions  : 6, 12, 72  (nrow, ncol, ncell)
resolution  : 0.08333333, 0.1666667  (x, y)
extent      : 0, 1, 0, 1  (xmin, xmax, ymin, ymax)
coord. ref. : +proj=longlat +datum=WGS84 +ellps=WGS84 +towgs84=0,0,0
data source : in memory
names       : layer
values      : 5, 298  (min, max)

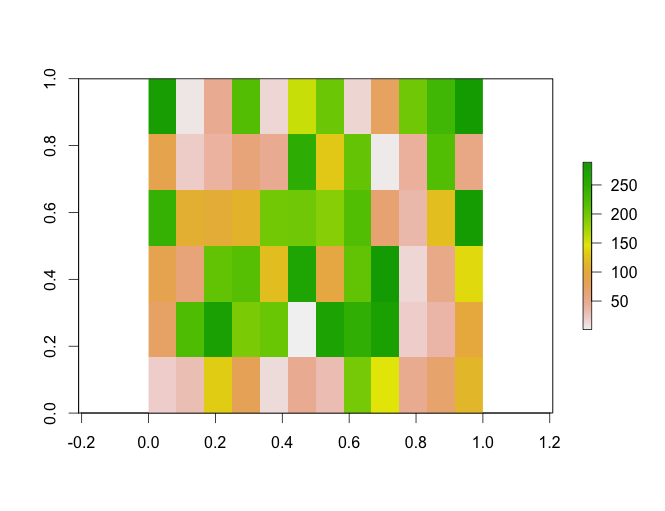
#レイヤーをプロット
plot(x)

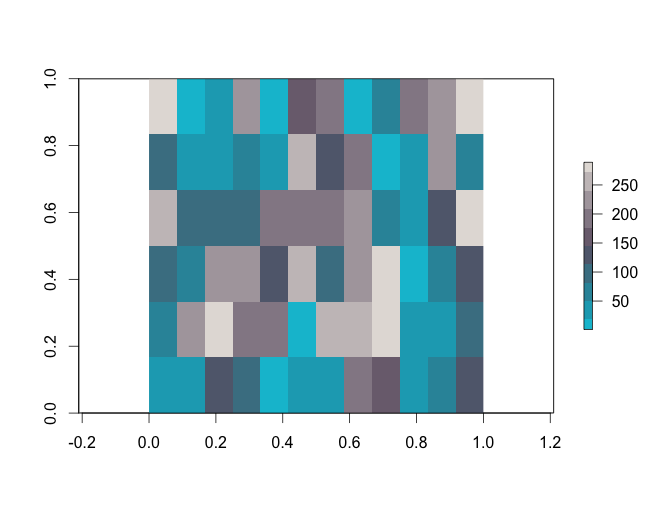
#セル色の変更
SetCol = colorRampPalette(c("#00bfd4", "#6e5f72", "#e3deda"))
plot(x, col = SetCol(10))
########

###以降、下記rasterを使用#####
##サイズを指定しレイヤーを作成
TESTRaster <- raster(nrow = 10, ncol = 10,
                     xmn = -1000, xmx = 1000, ymn = -100, ymx = 900)
values(TESTRaster) <- sample(1:10, 10 * 10, replace = TRUE)
plot(TESTRaster, col = SetCol(10))
########

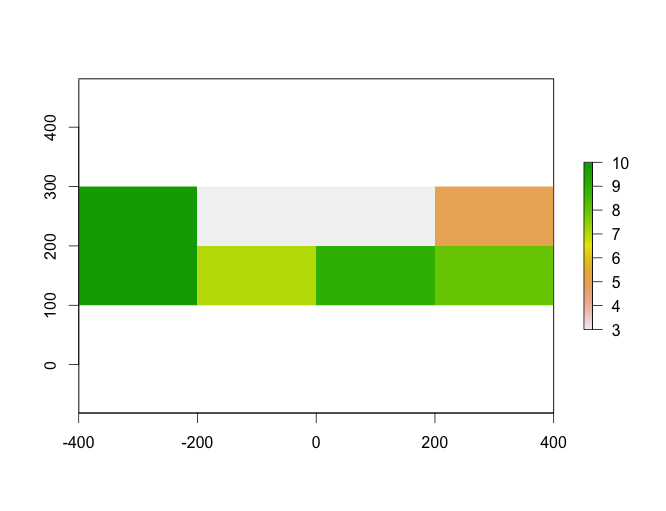
#トリミング:cropコマンド
#範囲の指定:extentオプション;(xmin, xmax, ymin, ymax)
#トリミングデータ1
CropRas1 <- crop(TESTRaster, extent(-300, 300, 100, 300))
plot(CropRas1)
#トリミングデータ2
CropRas2 <- crop(TESTRaster, extent(-1000, -500, 600, 800))
plot(CropRas2)

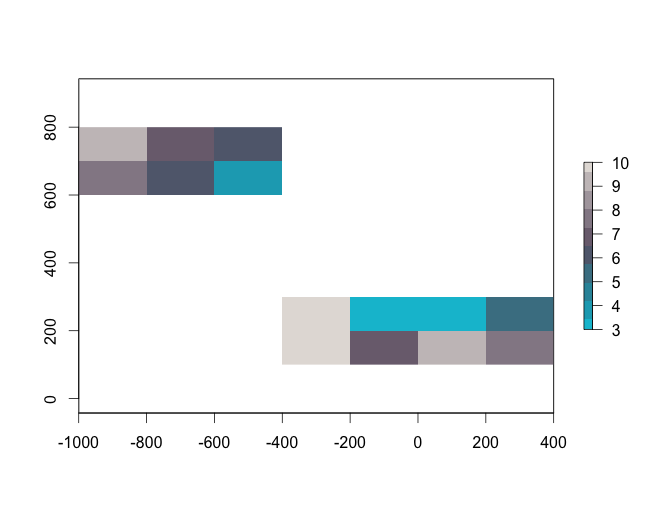
#ラスターデータの統合:mergeコマンド
CropMerge <- merge(CropRas1, CropRas2, overlap = TRUE)
plot(CropMerge, col = SetCol(10))

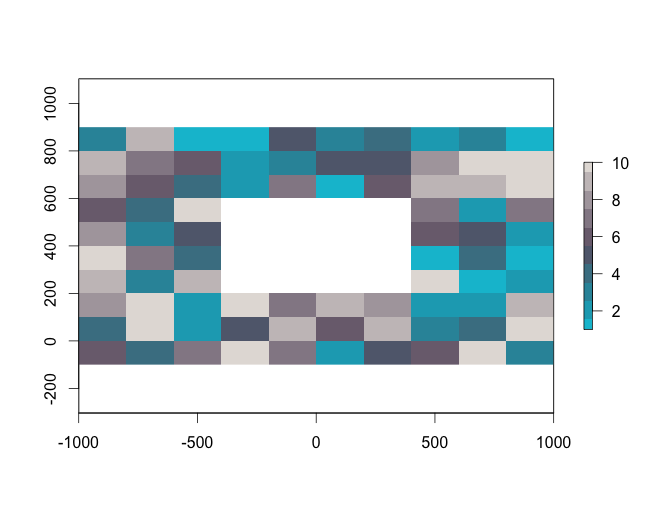
#切り抜き:セル番号を取得するcellsFromExtentコマンドの利用
#rasterの複製
CutOutRaster <- TESTRaster
#切り抜き範囲を値で指定
CellExtent <- cellsFromExtent(CutOutRaster, extent(-500, 500, 200, 600))
#範囲をNAで置き換え
CutOutRaster[CellExtent] <- NA
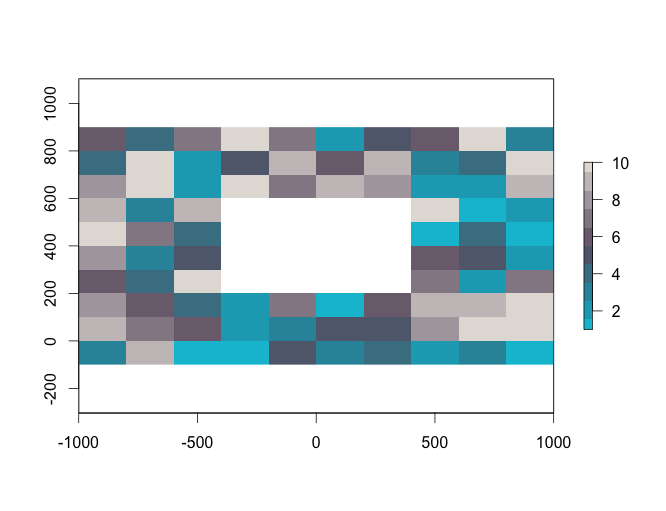
plot(CutOutRaster, col = SetCol(10))

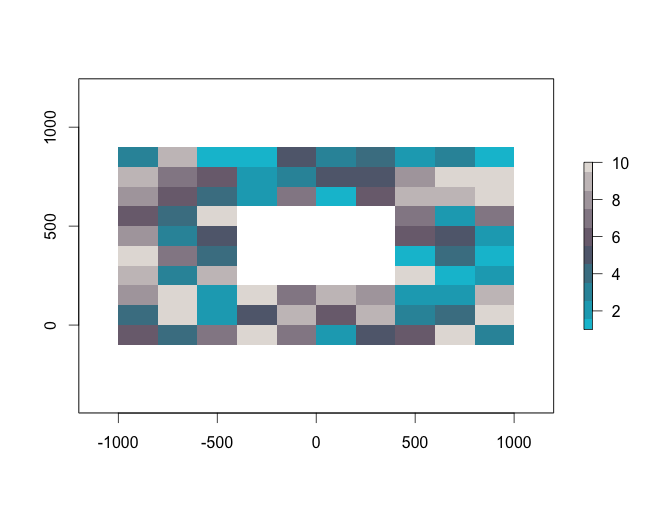
#周囲にセルを追加:extendコマンド
#追加するセル数を指定:yオプション
plot(extend(CutOutRaster, y = 1), col = SetCol(10))

#データの反転:flipコマンド
#基準軸を指定:directionオプション;"x" or "y"
FlipCutOutRaster <- flip(CutOutRaster, direction = "y")
plot(FlipCutOutRaster, col = SetCol(10))

#データの分布を確認:layerizeコマンド
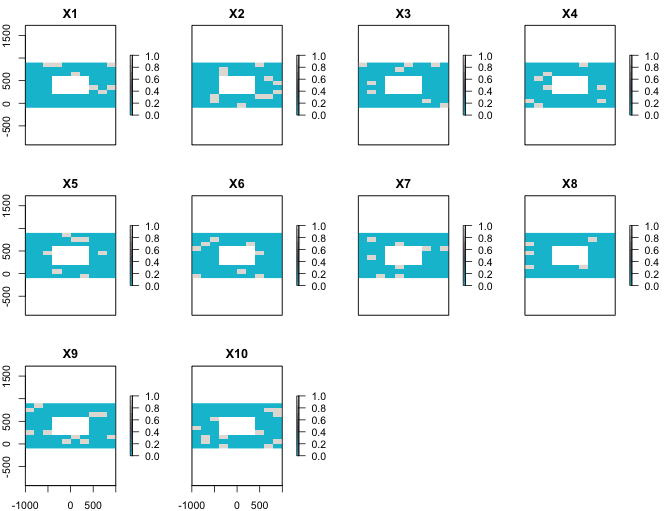
plot(layerize(CutOutRaster), col = SetCol(10))

#セルではなくシンボルでプロット:rasterToPointsコマンド
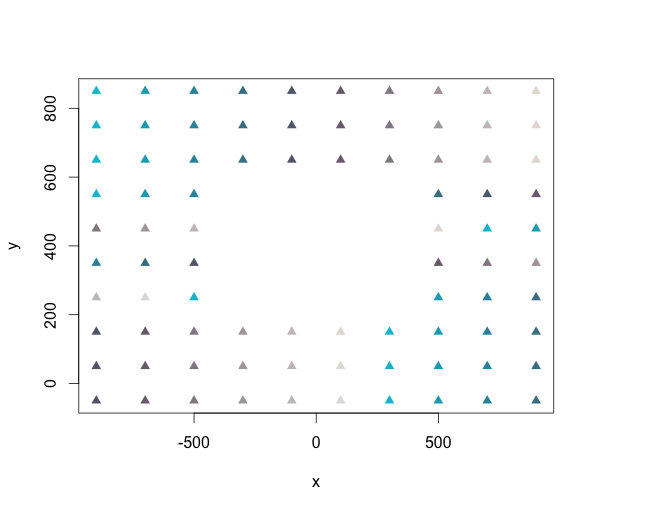
plot(rasterToPoints(CutOutRaster), col = SetCol(10), pch = 17)

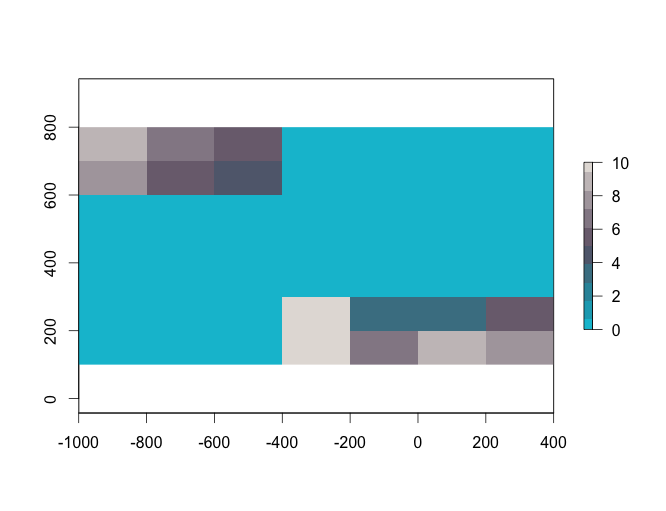
#データが無い箇所を0で埋めてラスターを結合:mosaicコマンド
MosaRaster <- mosaic(CropRas1, CropRas2, fun = sum)
plot(MosaRaster, col = SetCol(10))
出力例
・denstyコマンド
・histコマンド
・ディフォルトでプロット
・セル色を変更してプロット
・cropコマンド
・mergeコマンド
・cellsFromExtentコマンドの利用
・extendコマンド
・flipコマンド
・layerizeコマンド
・rasterToPointsコマンド
・mosaicコマンド
少しでも、あなたの解析が楽になりますように!!
スポンサーリンク