からだにいいもの
 Rで解析:図をインタラクティブに変換します!これは便利です「svgPanZoom」パッケージ
Baseコマンド、ggplot2パッケージなどの静的な図を、svg-pan-zoom.jsを利用して「インタラクティブに拡大・縮小が可能」な図に変換する「svgPanZoom」パッケージを紹介します。なお、「svgPanZoom」パッケージは「SVGAnnotation」パッケージと組み合わせて使用します。
例として、「UpSetR」、「tagcloud」、「VIM」の各パッケージとBaseコマンドを利用したカラーパレットの出力を紹介します。ぜひ、パッケージを活用ください。
パッケージのバージョンは0.2.0。R version 3.2.1でコマンドをWindows7ならびにMacOS10.10.4で確認しています。
<おすすめのRに関する書籍です>

パッケージのインストール
下記コマンドを実行してください。エラーが表示された場合は、表示に従い対応するRtoolsをダウンロードしてインストールしてください。詳細はコメントを確認してください。
http://cran.r-project.org/bin/windows/Rtools/
#svgPanZoomパッケージ
#devtoolsパッケージをインストールします。念のためstringiパッケージをインストールします。
install.packages(c("devtools", "stringi"))
devtools::install_github("timelyportfolio/svgPanZoom")

#SVGAnnotationパッケージ
install.packages("remotes")
remotes::install_github("duncantl/SVGAnnotation")

#Cairoパッケージ
install.packages("Cairo")実行コマンドの紹介
詳細はコメント、パッケージヘルプを確認してください。
#紹介に使用したパッケージのインストール
#UpSetパッケージ
devtools::install_github("hms-dbmi/UpSetR")
#tagcloudパッケージ
install.packages("tagcloud")
#VIMパッケージ
install.packages("VIM")

#ライブラリの読み込み
library("svgPanZoom")
library("SVGAnnotation")

#####準備#####################
#データ例の作成
TestData <- data.frame(Group = paste0("Group", 1:100),
                       Data1 = sample(0:1, 100, replace = TRUE),
                       Data2 = sample(0:1, 100, replace = TRUE),
                       Data3 = sample(0:1, 100, replace = TRUE),
                       Data4 = sample(0:200, 100, replace = TRUE),
                       Data5 = sample(100:300, 100, replace = TRUE))
##############################

###UpSetRパッケージとの組み合わせ例#####
#https://www.karada-good.net/analyticsr/r-152/
library("UpSetR")
library("ggplot2")
svgPanZoom(svgPlot(upset(TestData, sets.bar.color = "#56B4E9",
                         attribute.plots = list(gridrows = 60, ncols = 1,
                                                plots = list(list(plot = histogram, x = "Group", queries = TRUE),
                                                             list(plot = scatter_plot, x = "Group", y = "Data5", queries = TRUE))),
                         sets = c("Data1", "Data2", "Data3"),
                         queries = list(list(query = intersects, params = list("Data1"), active = FALSE),
                                        list(query = intersects, params = list("Data2"), active = TRUE)))),
           controlIconsEnabled = TRUE, height = 400, width = 400)

###tagcloudパッケージとの組み合わせ例#####
#https://www.karada-good.net/analyticsr/r-148/
library("tagcloud")
svgPanZoom(svgPlot(tagcloud(TestData[, 1], weights = TestData[, 2],
                            col = smoothPalette(TestData[, 2],
                                                palfunc = colorRampPalette(c("red", "#a87963", "gray", "#4b61ba"))),
                            order = "size", algorithm = "oval")),
           controlIconsEnabled = TRUE, height = 400, width = 400)

###VIMパッケージとの組み合わせ例#####
#https://www.karada-good.net/analyticsr/r-147/
#パッケージの読み込み
library("VIM")
#データ例の作成
n <- 50
TestData <- data.frame(Group = sample(paste0("Group", formatC(1:n, width = 2, flag = "0")),
                                      n, replace = TRUE),
                       Data1 = sample(c(NA, 1:10), n, replace = TRUE),
                       Data2 = sample(NA, n, replace = TRUE),
                       Data3 = sample(c(NA, 5:10), n, replace = TRUE),
                       Data4 = sample(c(NA, 7:10), n, replace = TRUE))

svgPanZoom(svgPlot(mosaicMiss(TestData[, 1:2],
                              col = c("#4b61ba", alphablend("#a87963", 0.6)))),
           controlIconsEnabled = TRUE, height = 400, width = 400)

###シャーロットキャラクターカラーパレットも動的にカラーパレットも動的に#####
#https://www.karada-good.net/analyticsr/r-135/
#記事の実行コマンドにsvgPanZoom、svgPlotコマンドの追記方法
svgPanZoom(
  svgPlot(

    {   ###データのプロット#####
      #軸の設定
      xRange <- seq(0, 1, by = 1/ItemVol)

      ###########省略##############

      #データのプロット
      rasterImage(as.raster(Plot[, 6]),
                  xRange[k], 0, xWidth[k], 1, interpolate = FALSE)

    }
    }

  ), controlIconsEnabled = TRUE, height = 400, width = 400)
出力例
スマートフォンでの閲覧は画面を横にすると見やすいです。
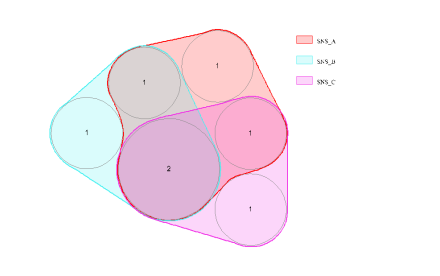
・UpSetRパッケージとの組み合わせ例
紹介記事:https://www.karada-good.net/analyticsr/r-152/
・tagcloudパッケージとの組み合わせ例
紹介記事:https://www.karada-good.net/analyticsr/r-148/
・VIMパッケージとの組み合わせ例
紹介記事:https://www.karada-good.net/analyticsr/r-147/
・シャーロットキャラクターカラーパレットも動的に
紹介記事:https://www.karada-good.net/analyticsr/r-135/
少しでも、あなたのウェブや実験の解析が楽になりますように!!
![RとPythonで学ぶ[実践的]データサイエンス&機械学習【増補改訂版】 | 有賀友紀, 大橋俊介](https://images-na.ssl-images-amazon.com/images/P/4297120224.09.LZZZZZZZ.jpg)