からだにいいもの
 Rでウェブ解析:ツイート内容に含まれる単語をネットワーク図で表示
ツイート内容に含まれる単語の関係(バイグラム)をネットワーク図で示すことができれば面白いかもと思い、RMecab、twitteR、qgraphパッケージを組み合わせコマンドを作成しました。
<おすすめのRに関する書籍です>

現場ですぐに使える! 最新R言語プログラミング逆引き大全323の極意
323項目の逆引きテクニック集。tidyverseやtidymodelsといったモダンな書き方もカバーしている。
 www.amazon.co.jp
使用パッケージのインストール
過去記事をご覧ください。
- Rとウェブ解析:お手軽!データをネットワークで表示「qgraph」パッケージの紹介
https://www.karada-good.net/analyticsr/r-47/ - Rでウェブ解析:テキストマイニングとタグクラウド
https://www.karada-good.net/analyticsr/r-10/ - Rでウェブ解析:Twitterデータの取得もおまかせ「twitteR」パッケージの紹介
https://www.karada-good.net/analyticsr/r-57/
スポンサーリンク
実行コマンドの紹介
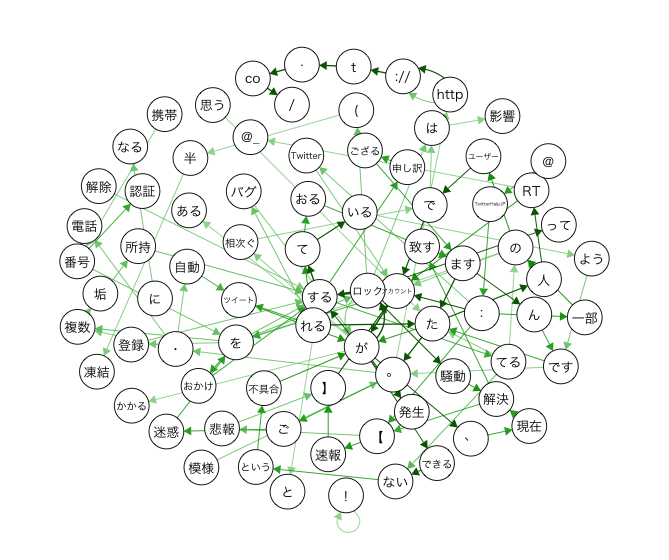
コマンドは作成途中にTwitterのアカウントロック騒動がありましたので、キーワード「アカウントロック」で検索し、バイグラムの出現数50以上を図をプロットしてみました。
#ライブラリの読み込み
library("twitteR")
library("RMeCab")
library("wordcloud")
library("RColorBrewer")
library("qgraph")

#情報の入力
consumerKey <- "Consumer Key (API Key)を入力"
consumerSecret <- "Consumer Secret (API Secret)を入力"

#処理の準備
twitCred <- OAuthFactory$new(consumerKey = consumerKey,
                             consumerSecret = consumerSecret,
                             requestURL = "https://api.twitter.com/oauth/request_token",
                             accessURL = "https://api.twitter.com/oauth/access_token",
                             authURL = "http://api.twitter.com/oauth/authorize")

#認証の実行
twitCred$handshake()
registerTwitterOAuth(twitCred)

#キーワードで検索
SearchWords <- c("アカウントロック")
TwGetDF <- twListToDF(searchTwitter(searchString = SearchWords, #検索キーワード
                                    n = 1000, #取得するツイート数
                                    #since = YYYY-MM-DD #取得する期間
))

###データの作成######
res <- docDF(TwGetDF, column = 1, type = 1, N = 2, nDF = TRUE) #バイグラムデータの作成
res <- cbind(res[, 1:2], rowSums(res[, 5:ncol(res)])) #単語の出現率を集計
res <- res[order(res[,3], decreasing = TRUE),] #出現数を降順で並び替え
########

#グラフのプロット
#出現数の設定
PlotData <- subset(res, res[, 3] > 50)

#MACでの文字化け防止
par(family = "HiraKakuProN-W3")

#グラフのプロット
qgraph(PlotData, layout = "spring")
プロット結果
矢印の色が濃いほど出現数が大きい組み合わせとなります。現在はアカウントロックの問題は解決したようです。
少しでも、あなたのウェブや実験の解析が楽になりますように!!

スポンサーリンク