からだにいいもの
 Rで解析:画像からカラーパレットを作成「lterpalettefinder」パッケージ
画像からカラーパレットを作成するパッケージの紹介です。PNG、JPEG、TIFF
、HEIC形式の画像からカラーパレットの作成が可能です。また、作成したカラーパレットをプロットで確認するコマンドも収録されています。
パッケージバージョンは1.0.0。windows11のR version 4.2.2で確認しています。
<おすすめのRに関する書籍です>

基礎からわかる時系列分析―Rで実践するカルマンフィルタ・MCMC・粒子フィルタ― Data Science Library
カルマンフィルタ・MCMC・粒子フィルタといった手法をRで実践しながら学ぶ時系列分析の一冊。
 www.amazon.co.jp
パッケージのインストール
下記コマンドを実行してください。
#パッケージのインストール
install.packages("lterpalettefinder")
スポンサーリンク
実行コマンド
詳細はコマンド、パッケージのヘルプを確認してください。
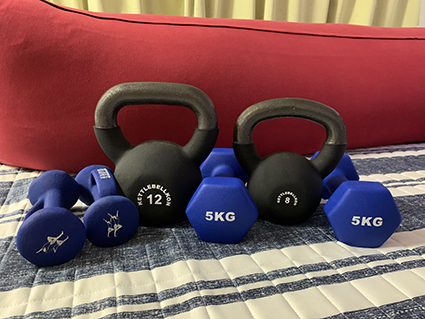
画像例:https://www.karada-good.net/wp/wp-content/uploads/2022/08/TEST.jpg
#パッケージの読み込み
library("lterpalettefinder")

###画像ファイルの準備#####
#画像例を作業フォルダにダウンロード
download.file('https://www.karada-good.net/wp/wp-content/uploads/2022/08/TEST.jpg',
              'KARADA.jpg', mode = 'wb')
#画像例を指定
library("tcltk")
Path <- paste0(as.character(tkgetOpenFile(title = "画像ファイルを選択",
                                          filetypes = '{"画像ファイル" {".*"}}',
                                          initialfile = c("*.*"))))
########

#画像から25色のパレットを作成:palette_extractコマンド
#画像[PNG,JPEG,TIFF,HEIC]を指定:imageオプション
#Hexコードの色相,彩度で並び替え:sortオプション;TRUE/FALSE
#処理中のプログレスバーを表示:progress_barオプション;TRUE/FALSE
ResultPalette <- palette_extract(image = Path,
                                 sort = TRUE,
                                 progress_bar = TRUE)
#結果:実行毎にパレット内容が若干異なります
ResultPalette
#[1] "#c04a4b" "#888787" "#dc5d5c" "#ee766e" "#7e6d50"
#[6] "#61594b" "#847c6d" "#ccb480" "#b8a16d" "#a28e5c"
#[11] "#a9a69d" "#ece3c6" "#dbd4bd" "#dfce8f" "#cbc6b2"
#[16] "#989793" "#b9b6a9" "#faf4d4" "#f1e79d" "#74767b"
#[21] "#66676a" "#4f5b9a" "#6f7bbe" "#555661" "#4a4a4f"

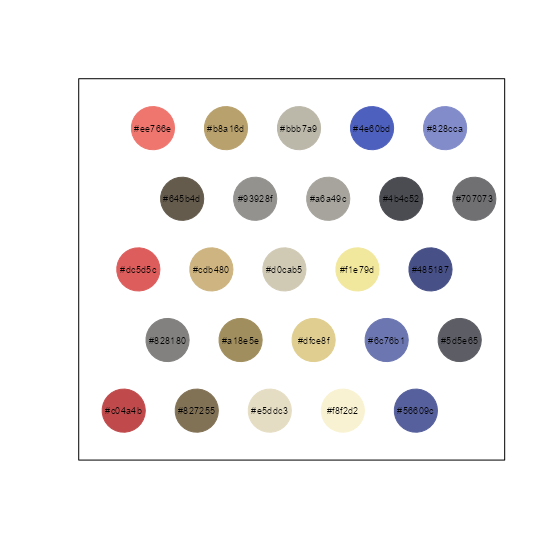
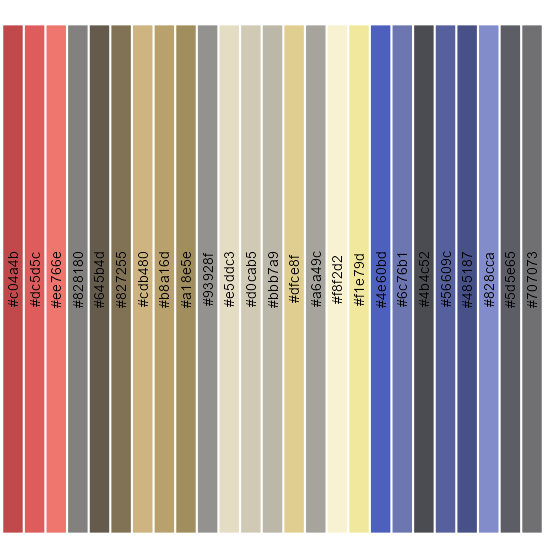
#作成したパレットの確認:palette_demo/palette_ggdemoコマンド
#基本のplotコマンドを利用して確認
palette_demo(palette = ResultPalette, export = FALSE)

#ggplot2パッケージを利用して確認
palette_ggdemo(palette = ResultPalette)

#カラーパレットから指定数の色をランダムに抽出:palette_subsampleコマンド
#抽出数の設定:wantedオプション
#再現性担保のためseedを指定:random_seedオプション
palette_subsample(palette = ResultPalette,
                  wanted = 5, random_seed = 42)
#[1] "#b9b6a9" "#7e6d50" "#c04a4b" "#a28e5c" "#ee766e"

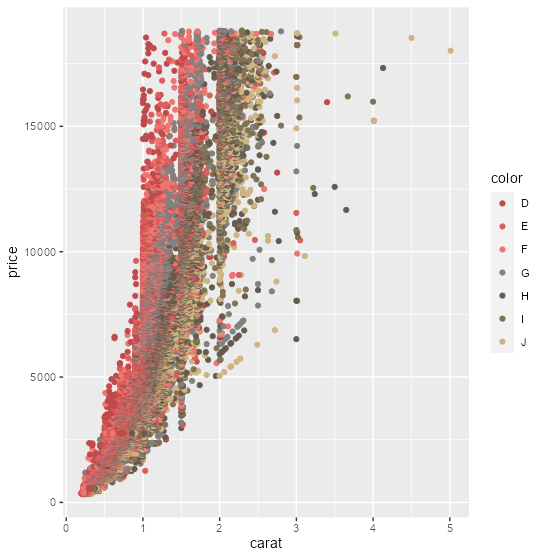
###例えば「ggplot2」パッケージで利用する#####
#「tidyverse」パッケージがなければインストール
if(!require("tidyverse", quietly = TRUE)){
  install.packages("tidyverse");require("tidyverse")
}

#プロット
ggplot(data = diamonds,
       aes(x = carat, y = price, col = color)) +
  geom_point() +
  scale_colour_manual(values = ResultPalette[1:7])
########
出力例
・基本のplotコマンドを利用して確認:「palette_demo」コマンド
・ggplot2パッケージを利用して確認:「palette_ggdemo」コマンド
・例えば「ggplot2」パッケージで利用する
少しでも、あなたの解析が楽になりますように!!
<おすすめのRに関する書籍です>
Rによる計量政治学 | 浅野正彦, 矢内勇生
政治現象を統計的に検証するための入門書。各章に練習問題があり、独学でも進めやすい構成。
スポンサーリンク