からだにいいもの
 Rで解析:棒グラフに入れ子構造で情報表示「ggtreebar」パッケージ
「ggtreebar」パッケージはggplot2::「geom_bar」コマンドと「geom_col」コマンド の各指標ごとに情報を入れ子構造で描画するツリーマップ棒グラフ (tree-bar chart)専用のgeomが利用可能です。分類階層を最大 3 段まで色分けし、サブグループ境界線やテキスト注釈を追加できるのが特長です。
パッケージバージョンは0.1.0。実行コマンドはR version 4.5.0で確認しています。
目的:製品カテゴリ×サブカテゴリ×ブランドの売上構成など、階層データの割合を棒グラフで示しながら内訳も一目で可視化したいデータの可視化。
<おすすめのRに関する書籍です>

 www.amazon.co.jp
パッケージのインストールと読み込み
下記、コマンドを実行してください。記事コマンドを実行するには「tidyverse」パッケージの読み込みが必要です。
# パッケージのインストール
install.packages("ggtreebar")

# パッケージの読み込み
library("ggtreebar")

# tidyverseパッケージの読み込み
# tidyverseパッケージがなければインストール
if(!require("tidyverse", quietly = TRUE)){
  install.packages("tidyverse");require("tidyverse")
}主なgeomと補助レイヤー
各コマンドはオプション「subgroup, subgroup2, subgroup3」に列名を指定するだけで、深い階層を入れ子構造で表示できます。
| 機能区分 | 関数 | 役割 |
|---|---|---|
| 基本ジオム | geom_treebar() / geom_treecol() | stat = "count"/"identity" に対応したツリーマップ棒グラフ |
| 境界線 | geom_treebar_subgroup_border() など | サブグループ別に罫線を引く (level 引数で 1〜3 段) |
| 注釈テキスト | geom_treebar_subgroup_text() など | サブグループ領域中央に文字列を配置 (自動折り返し) |
1. diamonds データで基本例
geom_treebar() は position = "stack" がデフォルトです。geom_treecol() を使うと stat = "identity" 指定で棒高さを値にできます。
ggplot(diamonds, aes(x = clarity, fill = cut, subgroup = color)) +
  geom_treebar() +
  scale_fill_brewer(palette = "Set3") +
  labs(title = "クラリティ別カット vs カラー 構成比")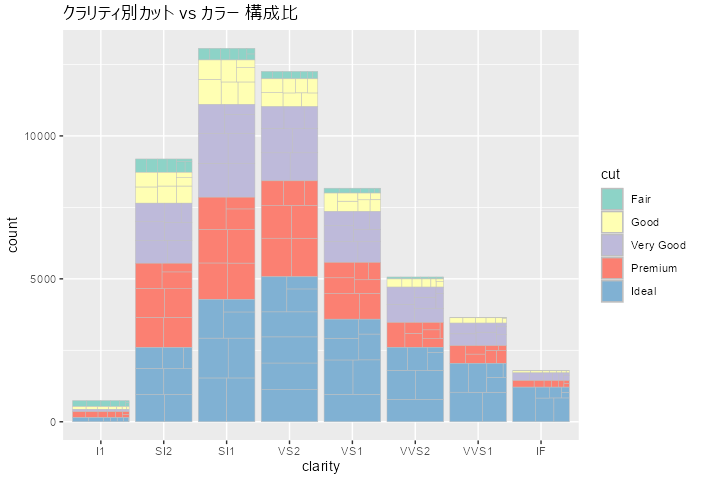
2. 境界線とテキスト注釈
オプション「position、layout、start 」は「geom_treebar」コマンドと補助レイヤーの「geom_treebar_subgroup_border」コマンド、「geom_treebar_subgroup_text」コマンドで同じに必要があります。
ggplot(diamonds, aes(y = cut, fill = color,
                     subgroup = clarity, subgroup2 = color)) +
  geom_treebar(position = "dodge") +
  geom_treebar_subgroup_border(position = "dodge", linewidth = 1) +
  geom_treebar_subgroup_text(position = "dodge", colour = "white", min.size = 3) +
  theme_minimal()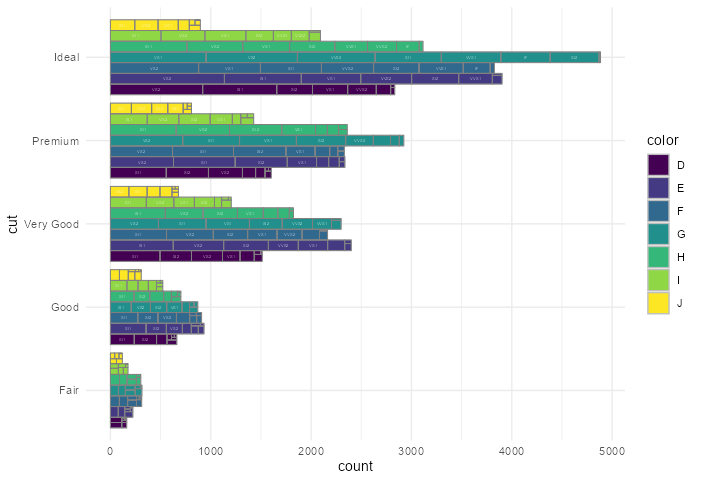
3. アイデンティティ棒と手動色設定
geom_treecol() は通常の積み上げ棒 (identity) と全く同じ感覚で使えます。
# データ例の作成
sales <- data.frame(
  sector   = rep(c("A","B"), each = 3),
  product  = rep(c("p1","p2","p3"), 2),
  value    = c(40,30,20,25,50,25)
)

# プロット
ggplot(sales, aes(x = sector, y = value, fill = product, subgroup = product)) +
  geom_treecol(stat = "identity", colour = "grey30", linewidth = .4) +
  scale_fill_manual(values = c("#66c2a5", "#fc8d62", "#8da0cb")) +
  labs(title = "部門別製品売上構成")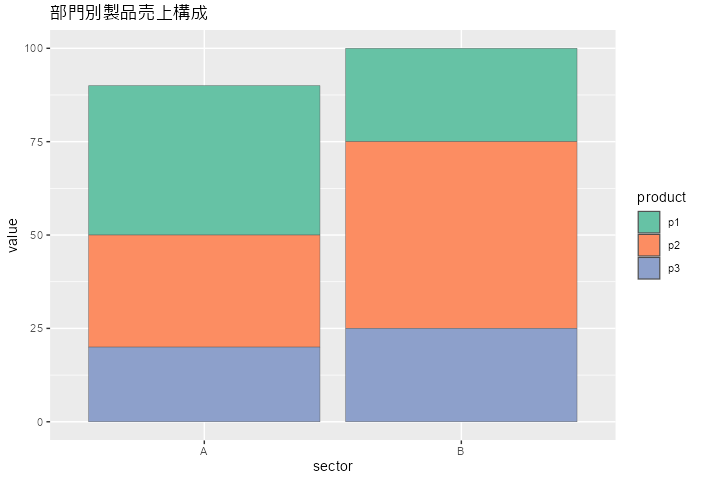
4. カスタムレイアウトの指定
各コマンドの「layout」オプションには「scol, srow, fixed 」が指定可能です。レイアウトは 最終ピクセル単位まで調整します。
# ggprismパッケージの読み込み
# ggprismパッケージがなければインストール
if(!require("ggprism", quietly = TRUE)){
  install.packages("ggprism");require("ggprism")
}

ggplot(diamonds, aes(clarity, fill = cut, subgroup = color)) +
  geom_treebar(layout = "scol", start = "topleft") +
  geom_treebar_subgroup_border(layout = "scol", start = "topleft",
                               colour = "black", linewidth = .8, linejoin = "round") +
  theme_prism()  # ggprism 等とも併用可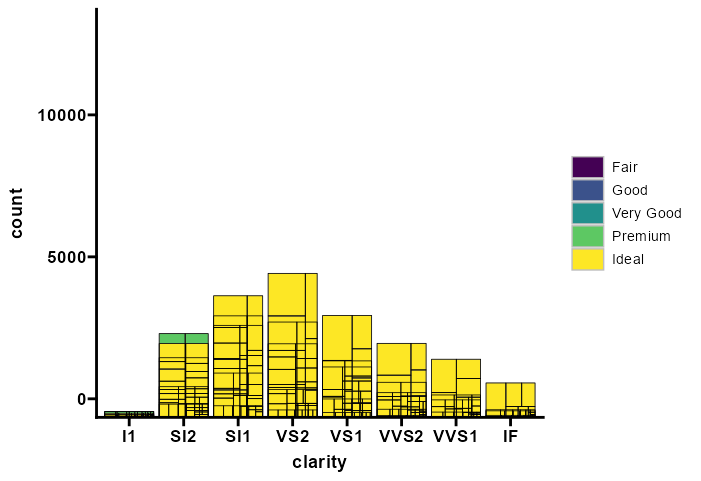
実行例
3カテゴリ (X, Y, Z) × 2サブグループ (alpha, beta) の乱数データを可視化した例です。
# --- オリジナルのサンプルデータ作成 ---
set.seed(123)
example_df <- data.frame(
  category = rep(c("X","Y","Z"), times = 2),
  subgroup = rep(c("alpha","beta"), each = 3),
  value    = sample(20:80, 6)
)

# --- ツリーバー描画 ---
library(ggplot2)
library(ggtreebar)

ggplot(example_df,
       aes(x = category, y = value,
           fill = subgroup, subgroup = subgroup)) +
  geom_treecol(stat = "identity",
               colour = "grey20", linewidth = .5) +
  scale_fill_brewer(palette = "Pastel1") +
  labs(title = "カテゴリ × サブグループ 構成比 (オリジナルデータ)")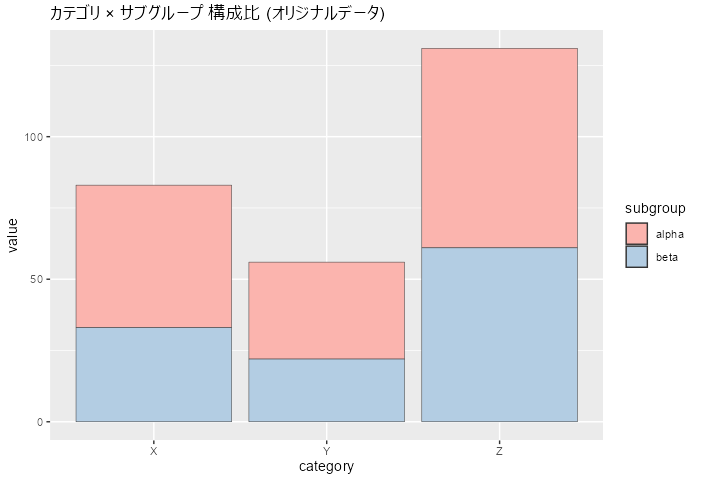
よくあるエラーと対処法
本パッケージだけでなく、「ggplot2」パッケージ利用時にも起こりうるエラーだと思います。
| 症状 | 原因 | 解決策 |
|---|---|---|
| Error: subgroup unspecified | subgroup aesthetics が未設定 | 必要列を aes() に指定する |
| Non-finite y values | stat = "identity" で y に NA | 欠損を除去 or 値を補完 |
| 凡例が重複 | 同じ fill を複数レイヤーで設定 | show.legend = FALSE を補助レイヤーに設定 |
おわりに
「ggtreebar」パッケージを使えば、棒グラフだけでは見落としがちな内訳構成を示せます。製品ツリー、人口ピラミッド、マーケティングファネルなど多層カテゴリを扱う可視化で威力を発揮すると思います。ぜひ試してみてください。
少しでも、あなたの解析が楽になりますように!!