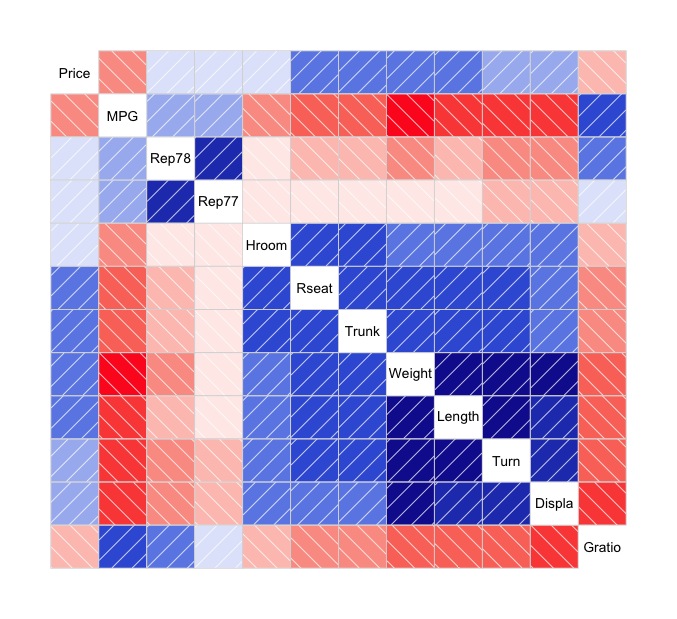
Analysis in R:I can see the relationship between indicators! The “corragram” package
Methods to show the relationship between indicators include …
 からだにいいもの
Rのトピックスを中心に『まだ、まだ、知らない、役に立つ情報?』を発信します。
Methods to show the relationship between indicators include …
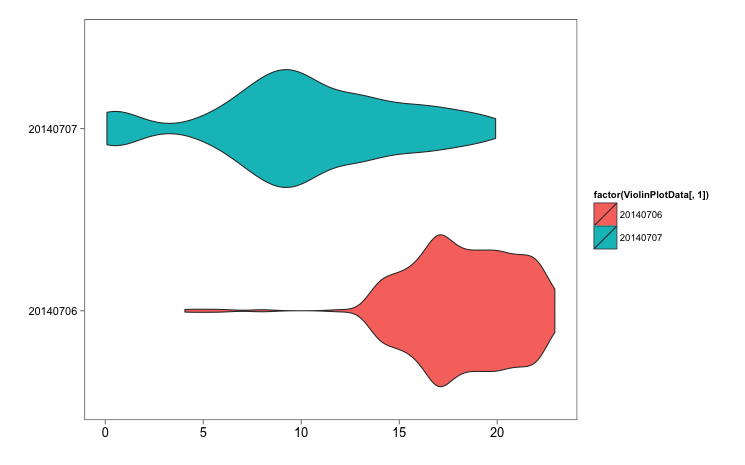
There are a number of charts that show trends in access, inc…
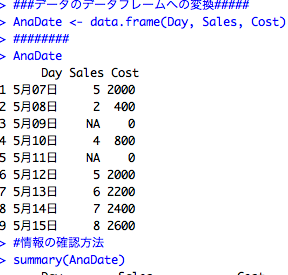
The use of R for web analysis is growing, but I think it is …

Many of you may use Excel to analyze data, but using R may r…
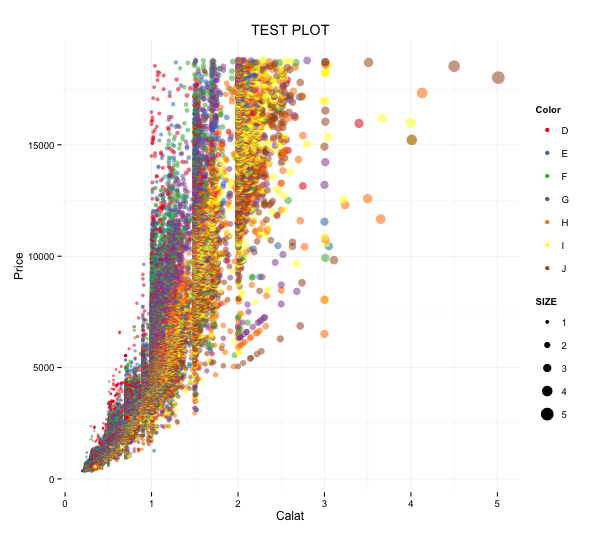
The ggplot2 package is a very powerful plotting package. We …
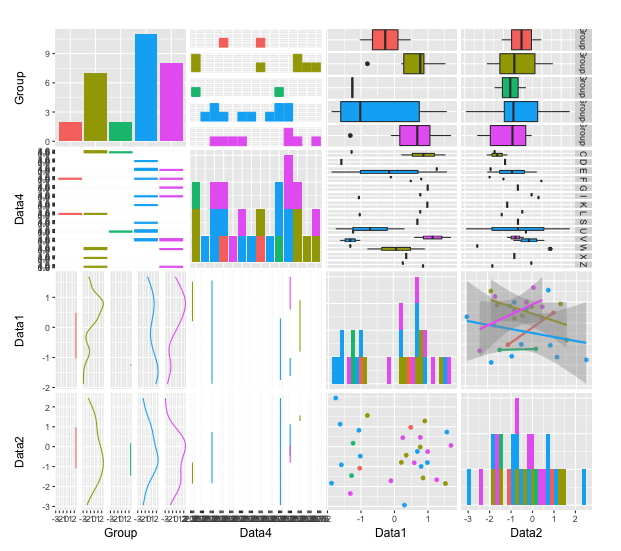
This is an introduction to a package for plotting multivaria…
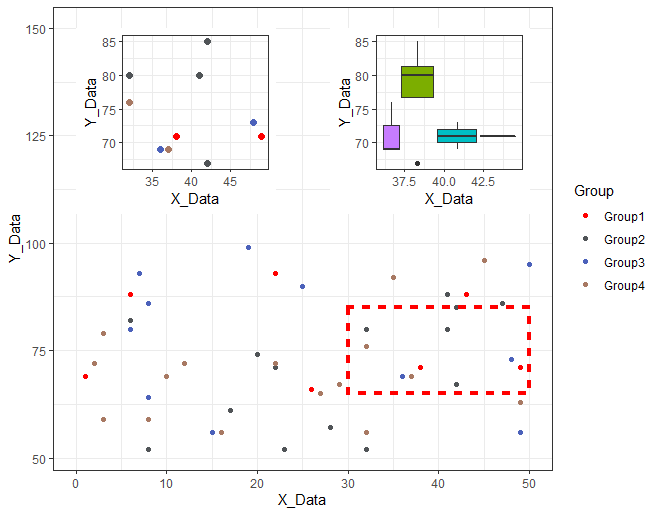
This is an introduction to a package that is useful for addi…
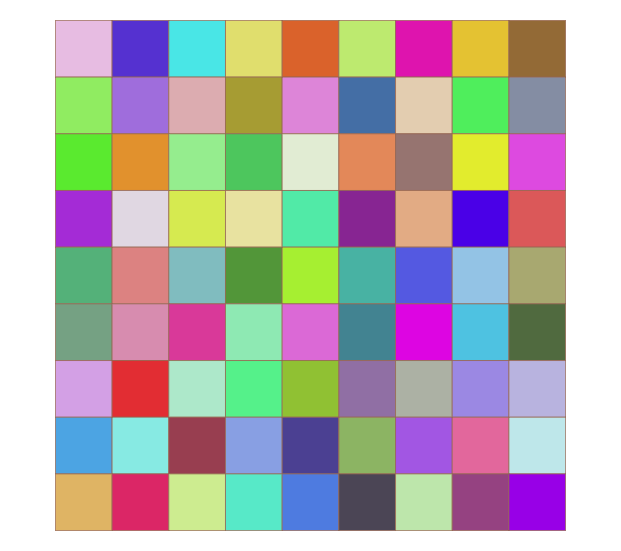
Color not only affects the quality of materials, but is also…
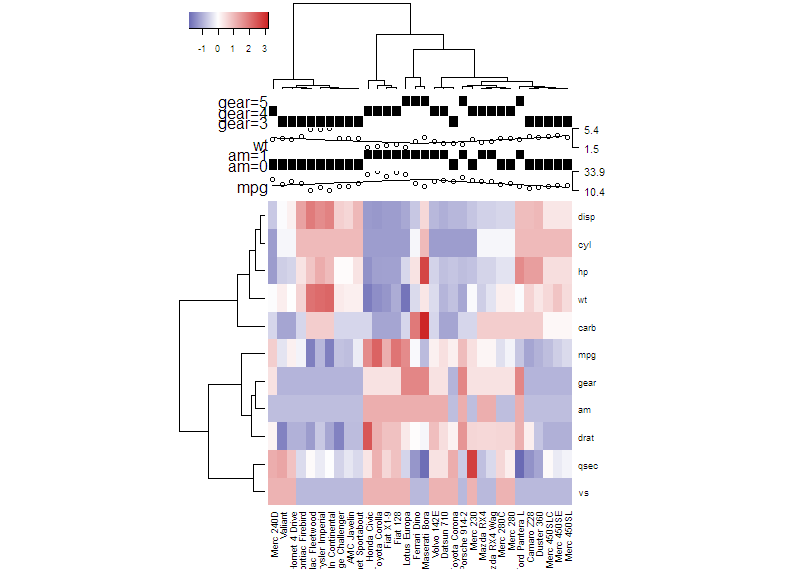
Heatmap is a way to visually display the size of numbers and…
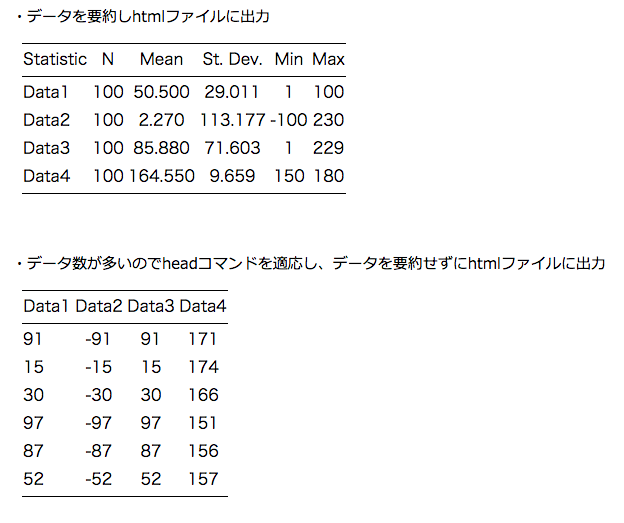
The “stargazer” package has a long history of ve…