 RAnalytics
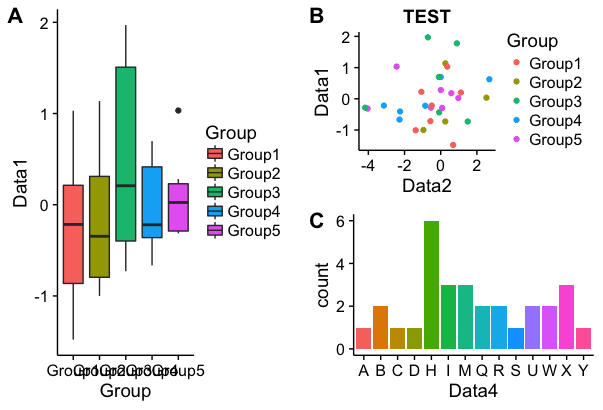
 Analysis in R: “bluepRint” package for plotting various ggplot objects
This is an introduction to a package that allows you to easily plot multiple ggplot2 objects. It wou...
 RAnalytics
  RAnalytics
  RAnalytics
  RAnalytics
 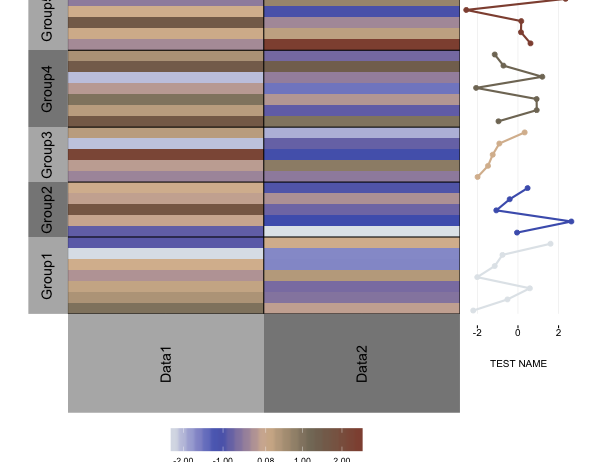 RAnalytics
 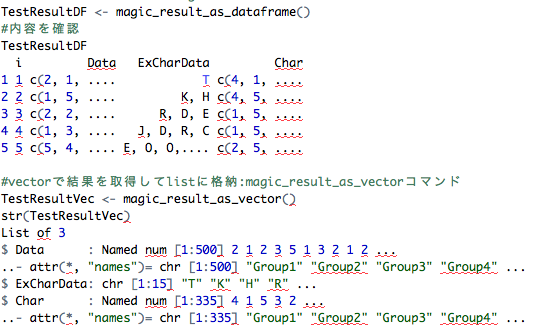 RAnalytics
 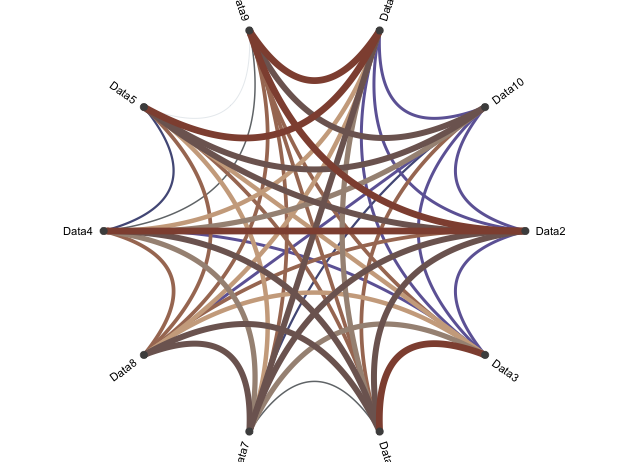 RAnalytics
 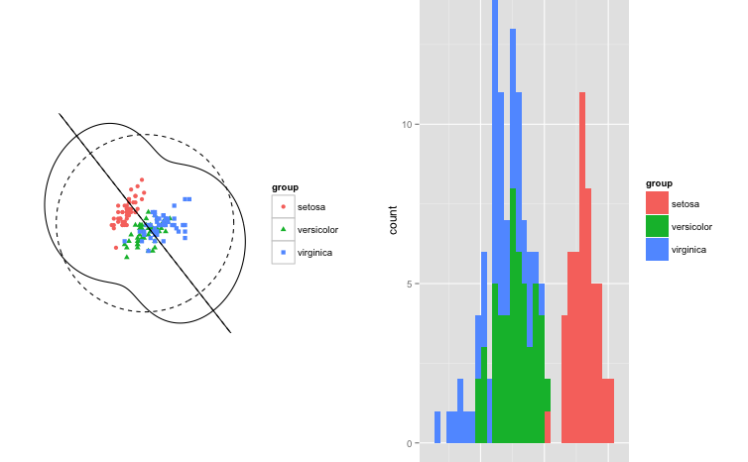 RAnalytics
  RAnalytics
 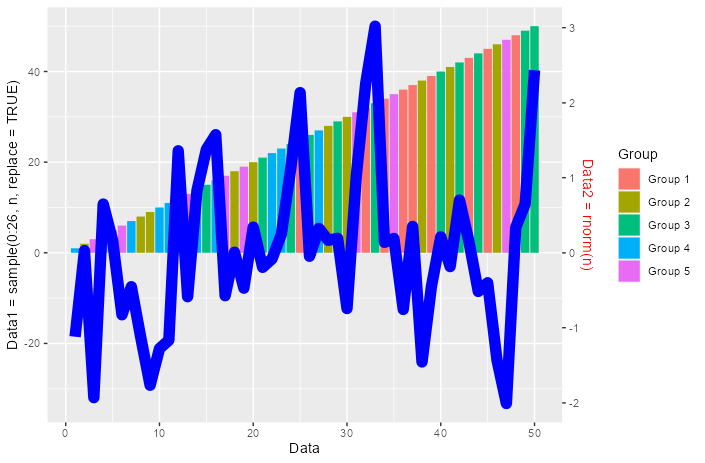 RAnalytics