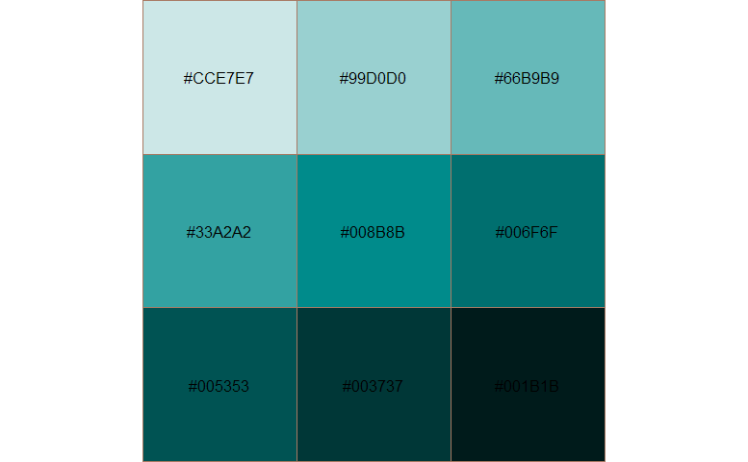
スポンサーリンク
RAnalytics

Analysis in R: Helps color labels in dendrograms. The “colorhcplot” package

This package is useful for color-coding dendrogram labels in groups. Package version is 1.3.. Checked with R version...
RAnalytics

Analysis in R: Summary value box plot “lvplot” package

It is a convenient way to express data distribution. You can use commands from the "ggplot2" package. This is useful...
RAnalytics

Command in R: An example of generating a random string using the “stringi” package

Sometimes it is necessary to generate random strings. In such cases, the "stri_rand_strings" command from the "stringi"...
RAnalytics

Analysis in R:The “mschart” package, which outputs editable graphs in Word and PowerPoint

This package can output charts that can be edited in Word and PowerPoint. You can create bar, line, scatter and area ch...
RAnalytics

Analysis in R: The “gghighlight” package is useful for highlighting parts of the plot.

This package is useful for creating graphs that highlight specified areas. Commands from the 'ggplot2' package are avai...
RAnalytics

Analysis in R: ‘DataExplorer’ package for a simple browser view of data content

This package allows you to easily check the data content in a browser. It is also possible to check data size, composit...
RAnalytics

Analysis in R: managing plots in the browser. The “httpgd” package

This package allows plots to be managed in a browser or RStudio's viewer. The operations that can be managed include sa...
RAnalytics

Analysis in R: Read a wide variety of files with ease. The ‘ezpickr’ package

This package reads files effortlessly via GUI. The supported 25 files are "csv, csv2, tsv, txt, xls, xlsx, json, html, ...
RAnalytics

Analysis in R: Helps you create the ideal heatmap. The “ComplexHeatmap” package

This package allows you to fine-tune the appearance of your heatmaps. For example, you can easily add a graph showing t...
RAnalytics

Analysis in R: Add significance bars to ggplot2 plots! The “ggsignifr” package

Introduces a package that adds a significant difference symbol to the plots of the "ggplot2" package. See the example o...
スポンサーリンク
タイトルとURLをコピーしました