スポンサーリンク
RAnalytics

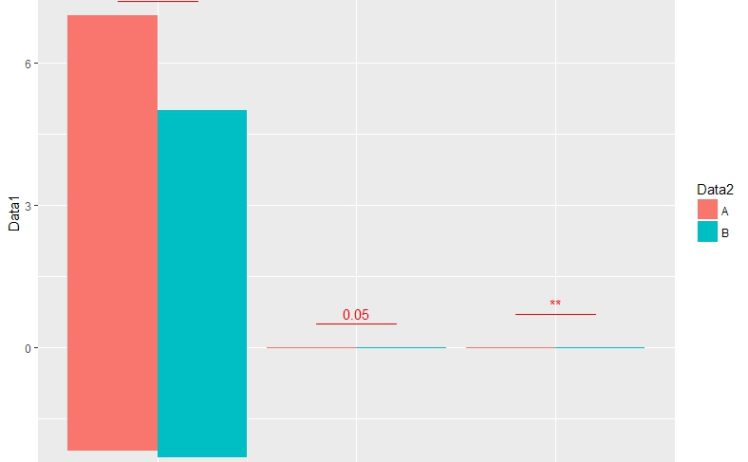
Analysis in R: Add significance bars to ggplot2 plots! The “ggsignifr” package

Introduces a package that adds a significant difference symbol to the plots of the "ggplot2" package...
RAnalytics

Analysis in R: Useful for continuous processing. How to “assign a value to a regular variable name” and “command R with a string”

This section introduces "how to create variable names (objects) and regularly assign values (data) t...
RAnalytics

Analysis in R: Summary of Color Specification Methods in ggplot2

This is a quick summary of how to specify col and fill colors in ggplot2, which is often forgotten. ...
RAnalytics

Analysis in R: Representing data features as circles. The “packcircles” package

This is an introduction to a package that displays the characteristics of data as a circle. Note tha...
RAnalytics

Analysis in R: “FITfileR” package to manipulate Garmin fit files

Smartwatches are increasingly used for health management and research. The "FITfileR" package is a c...
RAnalytics

Analysis in R: Plot statistics with ggplot2! The “ggstatsplot” package

This is an introduction to a package that is useful for plotting statistics together in ggplot2. The...
RAnalytics

Analysis in R: Examine all the characteristics of your data! The “tabplot” package

Introducing the "tabplot" package, which provides a graphical representation of the data in its enti...
RAnalytics

Analysis in R: “DataEditR package for interactively editing data in RStudio

This is an introduction to a package that allows you to edit data interactively in RStudio. Note tha...
RAnalytics

Analysis in R: PCA results in ggplot2 displayed in Biplot “ggbiplot” package

This is an introduction to the ggplot2 package for displaying the results of a principal component a...
RAnalytics

Analysing in R: outputting table displays to csv. Useful! ‘tableone’ package

The 'tableone' package displays the results of data processed in R in a table. As well as formatting...
スポンサーリンク