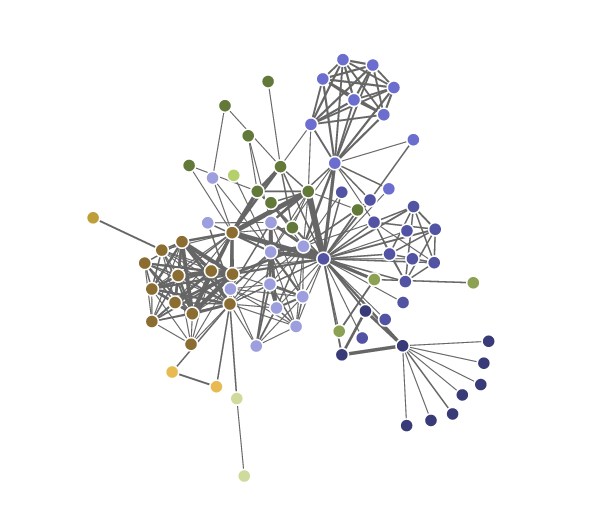
Analysis in R: Interactive Network Diagrams! The “networkD3” package
Introducing “networkD3” package, which allows yo…
 からだにいいもの
Rのトピックスを中心に『まだ、まだ、知らない、役に立つ情報?』を発信します。
Introducing “networkD3” package, which allows yo…
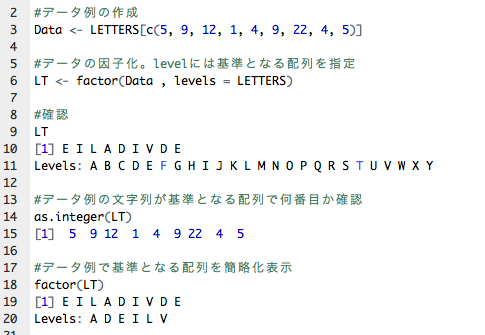
When manipulating data in R, you may create a vector or data…
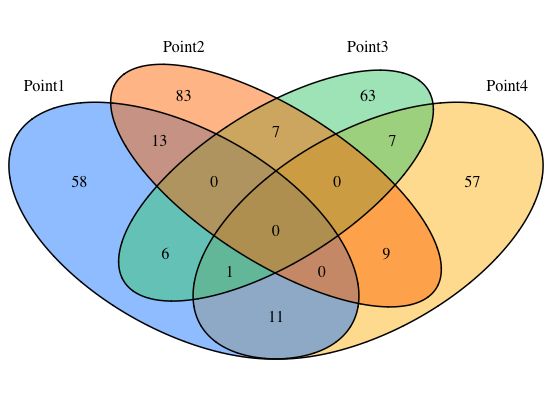
Venn diagrams are useful for interpreting data, and there ar…
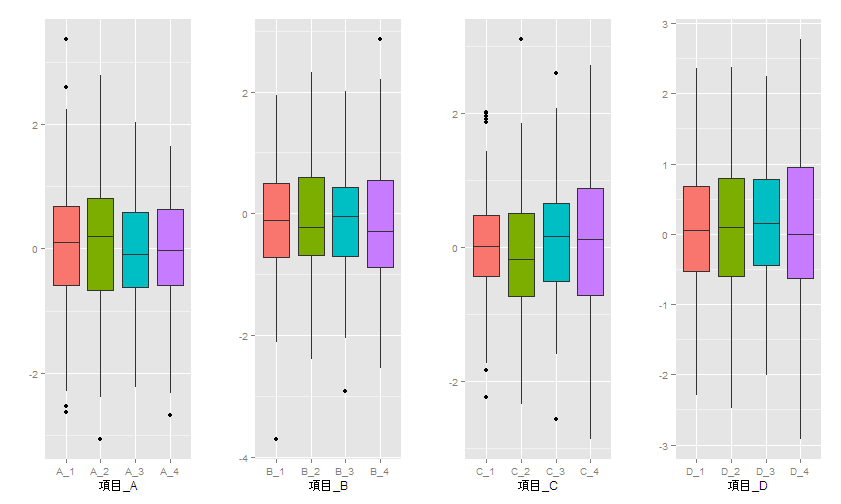
While row-by-row or column-by-column processing can be handl…
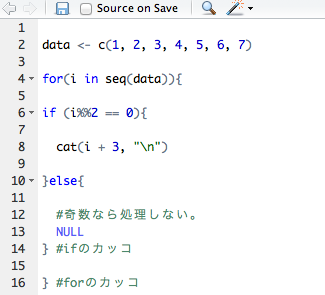
The R operation combines commands to process data and output…
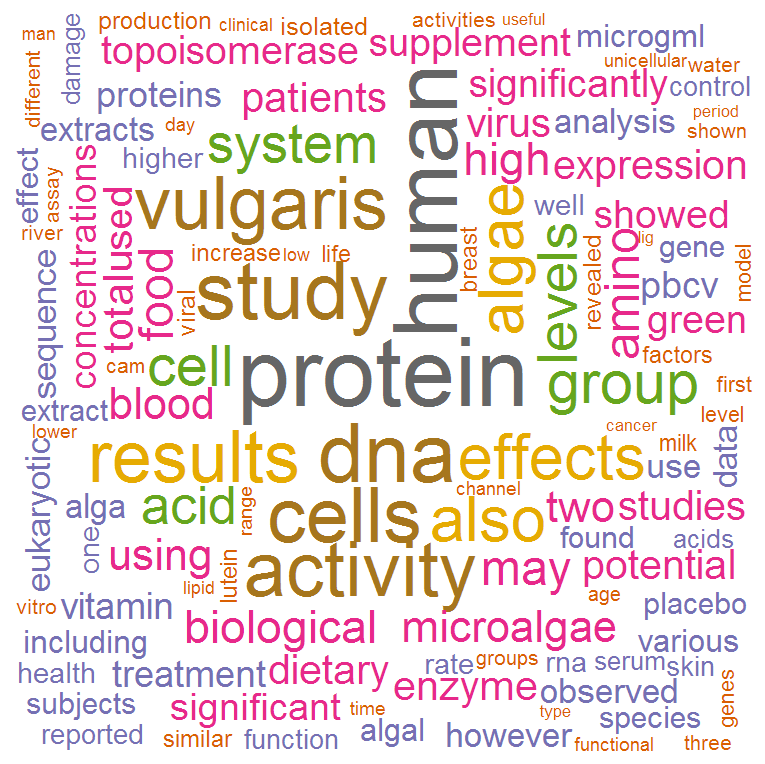
PubMed is a literature search site that outputs search resul…
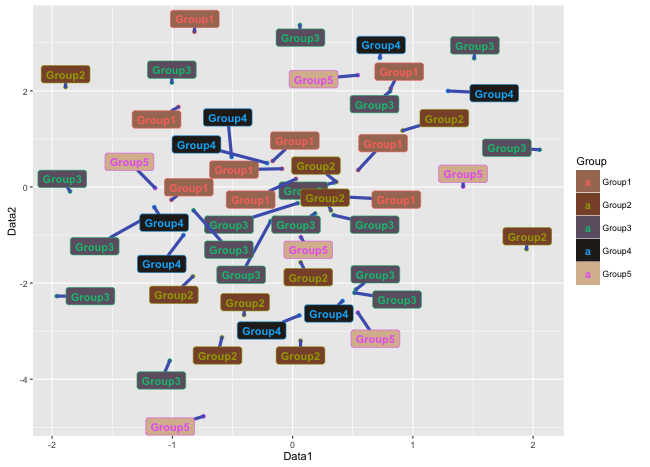
The ggplot2 package has a geom_point command that is useful …
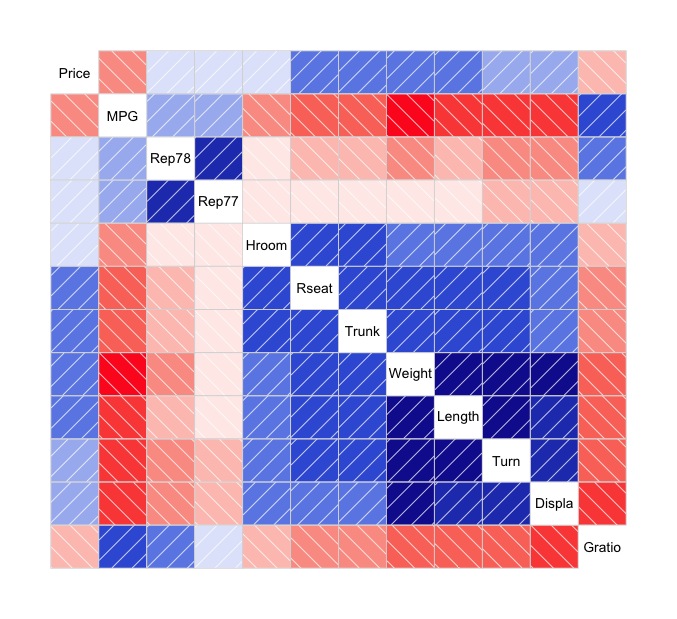
Methods to show the relationship between indicators include …
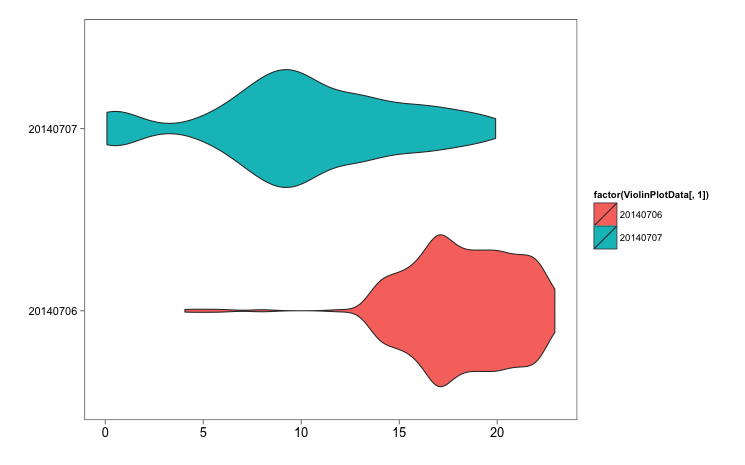
There are a number of charts that show trends in access, inc…
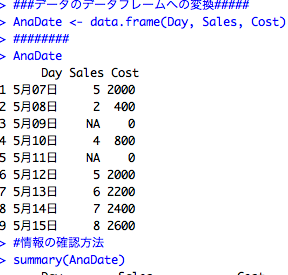
The use of R for web analysis is growing, but I think it is …