からだにいいもの
 Analysis in R: Helps color labels in dendrograms. The “colorhcplot” package
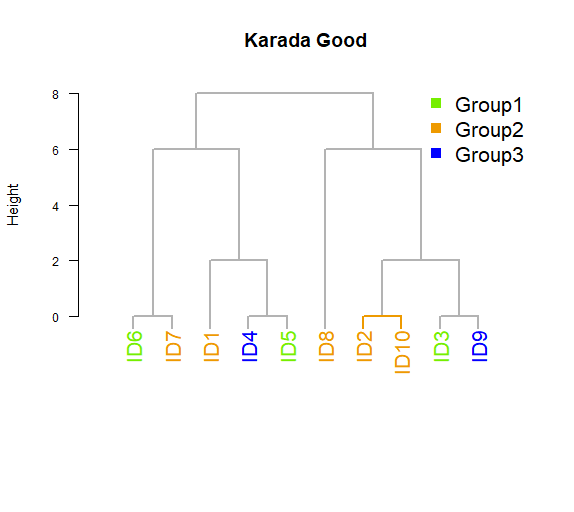
This package is useful for color-coding dendrogram labels in groups.
Package version is 1.3.. Checked with R version 4.1.2.
<おすすめのRに関する書籍です>

基礎から学ぶ統計学実践編〜PCを使った計算とカテゴリカルデータ解析
PCで実際に計算しながら進める実践編。クロス集計などカテゴリカルデータの解析を扱う。
 www.amazon.co.jp
Install Package
Run the following command.
#Install Package
install.packages("colorhcplot")
スポンサーリンク
Example
See the command and package help for details.
#Loading the library
library("colorhcplot")

###Creating Data#####
set.seed(1234)
n <- 10
TestData <- data.frame(row.names = paste0("ID", 1:n),
                       Group = as.factor(sample(paste0("Group", 1:3),
                                                n, replace = TRUE)),
                       Test_A = rnorm(n), Test_B = rnorm(n), Test_C = rnorm(n))
########

#Distance Calculation
#Loading the amap package to use the Spearman method
#Install the amap package if it is not already present
if(!require("amap", quietly = TRUE)){
  install.packages("amap");require("amap")
}
#Calculation
DistData <- Dist(TestData[, -1], method = "spearman")

#Clustring
#method option:"ward.D","ward.D2","single","complete","average",
#"mcquitty","median","centroid"
hTestData <- hclust(DistData, method = "complete")
########

#Plot the dendrogram: colorhcplot command
#Data:hc option
#Specify group data:fac option
#Specify hang value:hang option: negative value makes the label bottom
#Direction of y-axis labels:las option; 1:vertical,0:horizontal
colorhcplot(hc = hTestData, fac = TestData[, 1],
            hang = -1, main = "Karada Good",
            lab.cex = 1.3, lwd = 2, las = 1,
            color = c("chartreuse2", "orange2", "blue"))
Output Example
・colorhcplot command
I hope this makes your analysis a little easier !!

スポンサーリンク