からだにいいもの
 Analysis in R: “geomtextpath” package, which places text on a path
Introducing a package that makes it easy to place text on paths plotted by the “ggplot2” package.
Package version is 0.1.0. Checked with R version 4.2.2.
<おすすめのRに関する書籍です>

サラっとできる!フリー統計ソフトEZR(Easy R)でカンタン統計解析
EZRでの統計解析をコンパクトにまとめた一冊。必要な手順だけを素早く確認したいときに。
 www.amazon.co.jp
Install Package
Run the following command.
#Install Package
install.packages("geomtextpath")
スポンサーリンク
Example
See the command and package help for details.
#Loading the library
library("geomtextpath")

#Install the tidyverse package if it is not already there
if(!require("tidyverse", quietly = TRUE)){
  install.packages("tidyverse");require("tidyverse")
}

###Creating Data#####
set.seed(1234)
n <- 30
TestData <- tibble(Group = sample(paste0("Group", 1:4), n,
                                  replace = TRUE),
                   X_Data = sample(c(1:50), n, replace = TRUE),
                   Sin_Data = sin(1:n) * 30:1,
                   Cos_Data = cos(1:n) * 30:1)

#Text data
#Markdown,HTML,CSS. Color, Font, Font Size,
#Bold, Italic, Subscript, Superscript available.
TextData <- "<b style='color:black'>からだにいいもの</b>_KARADANI IIMONO"
########

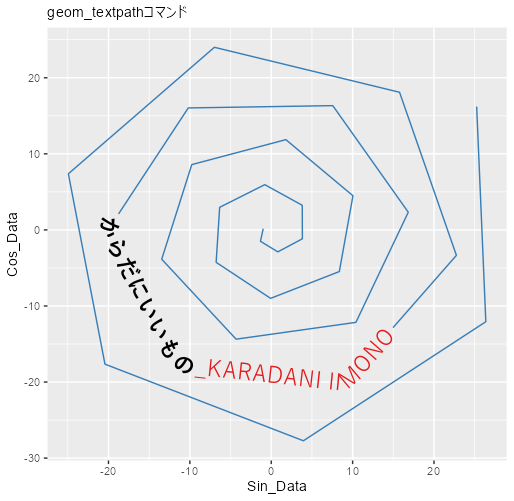
#Placing text on a path: geom_textpath command
#Text data: label option; can also be set within ggplot command
#Plot position on path: hjust option; 0-1 range
#Adaptive adjustment of text to path: text_smoothing option; range 0-100
#Placement on paths that are too short: remove_long option; TRUE,FALSE
#Adaptability of Markdown, HTML, CSS: rich option; TRUE,FALSE
#Font size: size option
#Font,Line color: textcolour,linecolour option
ggplot(TestData, aes(x = Sin_Data, y = Cos_Data)) +
  geom_textpath(label = TextData,
                hjust = 0.5,
                text_smoothing = 10,
                remove_long = FALSE,
                rich = TRUE,
                size  = 6,
                textcolour = "#E41A1C",
                linecolour = "#377eb8",
                family = "Yu Gothic") +
    labs(subtitle = "geom_textpathコマンド")

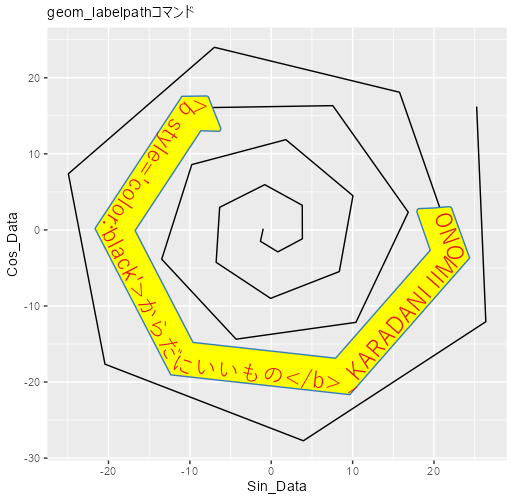
#Placing a text label on a path: geom_labelpath command
#See geom_textpath command for options
ggplot(TestData, aes(x = Sin_Data, y = Cos_Data)) +
  geom_labelpath(label = TextData,
                 hjust = 0.5,
                 size  = 6,
                 rich = FALSE,
                 textcolour = "#E41A1C",
                 boxcolour = "#377eb8",
                 fill = "yellow",
                 family = "Yu Gothic") +
  labs(subtitle = "geom_labelpathコマンド")

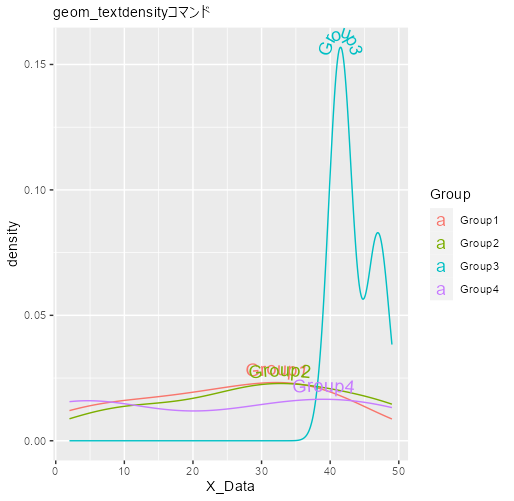
#Placing text on a graph: geom_textdensity command
#Positioning position based on element data: hjust option;
#"xmin","xmid","xmax","ymin","ymid","ymax","auto"
ggplot(TestData, aes(x = X_Data,
                     colour = Group,
                     label = Group)) +
  geom_textdensity(hjust = "ymax",
                   vjust = -0.3,
                   size = 5) +
  labs(subtitle = "geom_textdensityコマンド")
Output Example
・geom_textpath command
・geom_labelpath command:rich = FALSE
・geom_textdensity command
I hope this makes your analysis a little easier !!
スポンサーリンク