からだにいいもの
 Analysis in R: Introduction to Distribution Commands
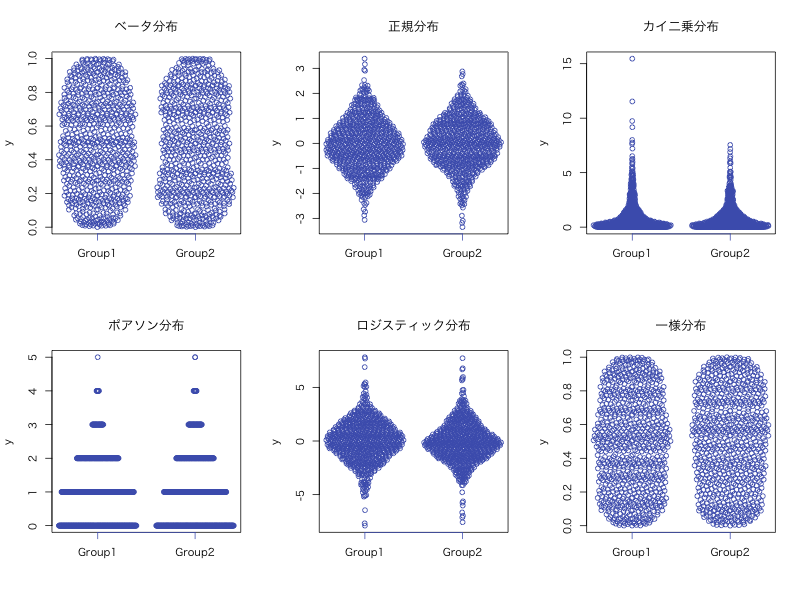
Here are some commonly used distribution commands. To get a random value, add “r” before each command.
Please check out the commands introduced in the help file and the “various distribution commands” included in the basic commands, which may be a step toward learning R.
Note that the “vipor” package is used for the beeswarm plot.
Checked with R version 4.2.2.
Example
See the command and package help for details.
#Install Package
install.packages("vipor")

#Loading the library
library("vipor")

###Creating Data#####
n <- 1500
TestDF <- data.frame(Group = sample(paste0("Group", 1:2), n, replace = TRUE),
                     "beta distribution" = rbeta(n, 1, 1, ncp = 0),
                     "normal distribution" = rnorm(n),
                     "Chi-square distribution" = rchisq(n, 1),
                     "Poisson distribution" = rpois(n, 1),
                     "Logistic distribution" = rlogis(n, 0, 1),
                     "uniform distribution" = runif(n, 0, 1))
#####

par(mfrow = c(2,3))

for(n in 1:6){
  vpPlot(TestDF[, 1], TestDF[, n + 1], pch = 21, col = "#4b61ba",
         main = colnames(TestDF[n + 1]), alpha = .1)
}
スポンサーリンク
Output Example
I hope this makes your analysis a little easier !!
スポンサーリンク