からだにいいもの
 Analysis in R: More than, Less than! Manipulation of data “fancycut” package
This is an introduction to a package that is useful for creating a specified range of data from the parent data. After manipulation, the data may need to be processed with “unique” commands, but in most cases the range of this package will solve the problem.
Package version is 0.1.2. Checked with R version 4.2.2.
<おすすめのRに関する書籍です>

Rで学ぶプログラミングの基礎の基礎 | 舟尾暢男
統計以前のプログラミングの考え方から始めるRの入門書。つまずきやすい部分を丁寧に扱う。
Install Package
Run the following command.
#Install Package
install.packages("fancycut")
スポンサーリンク
Example
See the command and package help for details.
#Loading the library
library("fancycut")

###Creating Data#####
TestData <- sample(1:10, 100, replace = TRUE)
########

#Process with specified data range and label:fancycut command
#"(";not including
#"[";including
FcData <- fancycut(TestData,
                   Small = "[1, 3]", Medium = "(4, 6)", Large = "[8, 10]",
                   na.bucket = "Test", unmatched.bucket = "Test")

#Combine with original data
TeFcData <- data.frame(TestData, FcData)

#Check
#table command
table(TeFcData)
FcData
TestData Small Medium Large Test
1      6      0     0      0
2     10      0     0      0
3      8      0     0      0
4      0      0     0     11
5      0     10     0      0
6      0      0     0     13
7      0      0     0      9
8      0      0    11      0
9      0      0    13      0
10     0      0     9      0

#xtabs command
xtabs(~TeFcData[, 2])
TeFcData[, 2]
Small Medium  Large Test
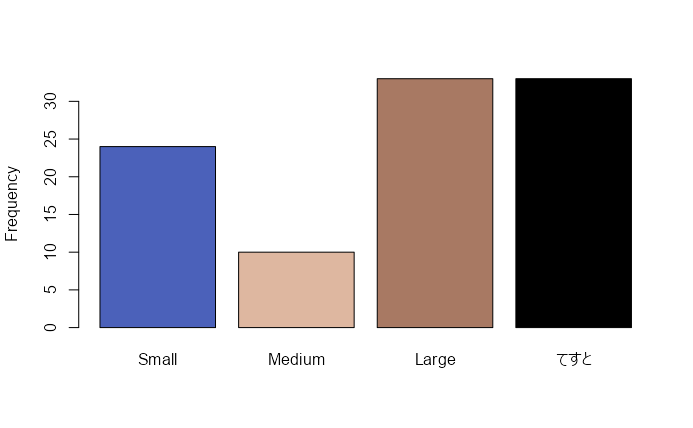
24     10     33     33

#Plot
barplot(xtabs(~TeFcData[, 2]), ylab = "Frequency",
        col = c("#4b61ba", "#deb7a0", "#a87963", "black"))
Output Example
I hope this makes your analysis a little easier !!


スポンサーリンク