からだにいいもの
 Analysis in R: “CatterPlot” package: SCATTER PLOT with cat symbols!
This package is for those who want to create scatter charts with cat symbols. I don’t know if it rhymes, but the “s” in “scatter” has been removed and it’s “catter”. The cat symbols seem to be added from time to time.
The code for saving, loading, and plotting images in the package may be helpful.
・GitHub:Gibbsdavidl/CatterPlot
https://github.com/Gibbsdavidl/CatterPlot
Package version is 0.0.2. Checked with R version 4.2.2.
<おすすめのRに関する書籍です>

Rによる統計解析 | 青木繁伸
多くの統計手法をRの関数とともに整理した一冊。手法ごとの使い方を確認するリファレンスとして役立つ。
Install Package
Run the following command.
#Install Package
install.packages("devtools")
devtools::install_github("Gibbsdavidl/CatterPlot")
スポンサーリンク
Example
See the command and package help for details.
#Loading the library
library("CatterPlot")

#Plotting symbols with cats:catplot command
#Specify symbol type:catmode;
par(mfrow=c(2,2))
for(n in seq(length(catdat))){

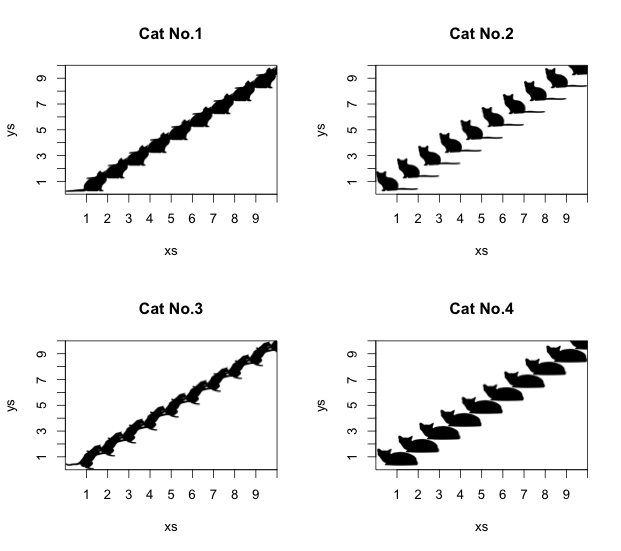
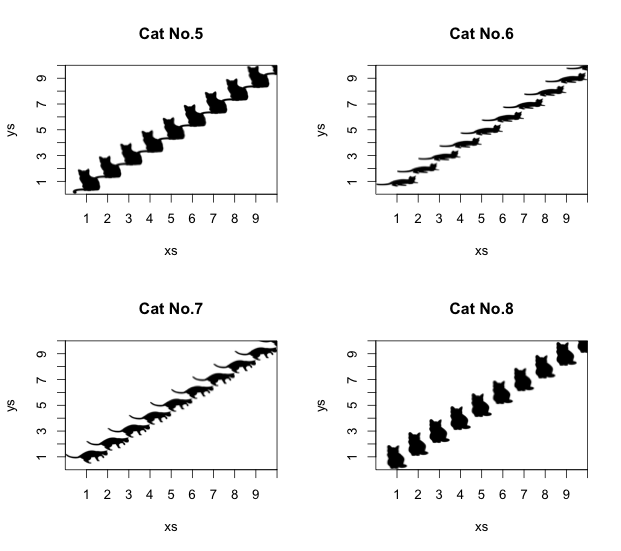
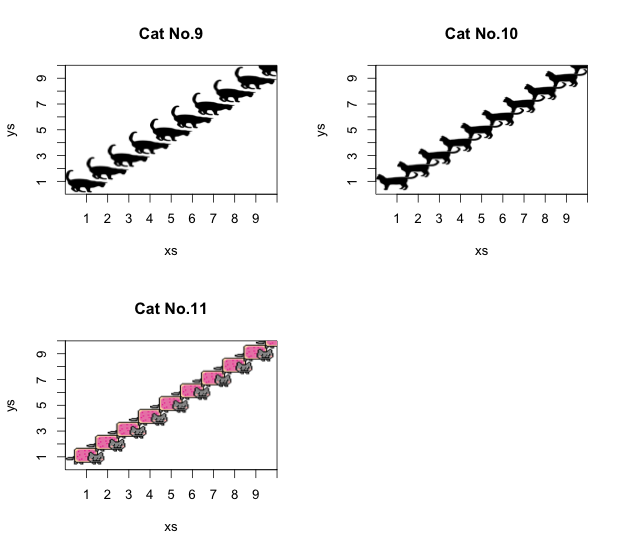
catplot((1:10), (1:10), size = 0.2, catmode = n, title = paste0("Cat No.", n))

}
Output Example
・Cat No.1-4
・Cat No.5-8
・Cat No.9-11
I hope this makes your analysis a little easier !!


スポンサーリンク