からだにいいもの
 Analysis in R: Plot statistics with ggplot2! The “ggstatsplot” package
This is an introduction to a package that is useful for plotting statistics together in ggplot2. The package also includes commands for plotting correlations in a heatmap. Please see the following URL for details.
ggstatsplot: ggplot2 Based Plots with Statistical Details
https://indrajeetpatil.github.io/ggstatsplot/
Package version is 0.9.1. Checked with R version 4.2.2.
<おすすめのRに関する書籍です>

多変量解析の基礎 II 主成分分析(改訂版): 理論とRによる演習
主成分分析に絞って理論を丁寧に追い、Rの演習で確認する構成。数式の意味を腹落ちさせたい人向け。
 www.amazon.co.jp
Install Package
Run the following command.
#Install Package
install.packages("ggstatsplot")
スポンサーリンク
Example
See the command and package help for details.
#Loading the library
library("ggstatsplot")
#Install the PMCMRplus package if it is not already there
if(!require("PMCMRplus", quietly = TRUE)){
  install.packages("PMCMRplus");require("PMCMRplus")
}
#Install the ggside package if it is not already there
if(!require("ggside", quietly = TRUE)){
  install.packages("ggside");require("ggside")
}

###Creating Data#####
n <- 60
TestData <- data.frame("Group" = rep(paste0("Group", 1:3), each = 20),
                       "Data1" = sample(rnorm(500), n, replace = TRUE),
                       "Data2" = sample(rnorm(500), n, replace = TRUE),
                       "Letter" = sample(LETTERS[1:3], n, replace = TRUE))

TestData[, 2] <- TestData[, 2] + rep(c(0, .8, .3), each = 20)
TestData[, 3] <- TestData[, 3] + rep(c(0, 4, 10), each = 20)

#Check
#str(TestData)
########

#Creating box and violin plots with statistical information:
#ggbetweenstats command
#Graph settings:plot.type option; "box", "violin", "boxviolin"
#Hypothesis of the distribution: type option; "parametric", "nonparametric", "robust", "bayes".
#p-value adjustment method: "p.adjust.method", "holm", "hochberg", "hommel", "bonferroni",
#"BH", "BY", "fdr", "none"
#of decimal places to display: k options
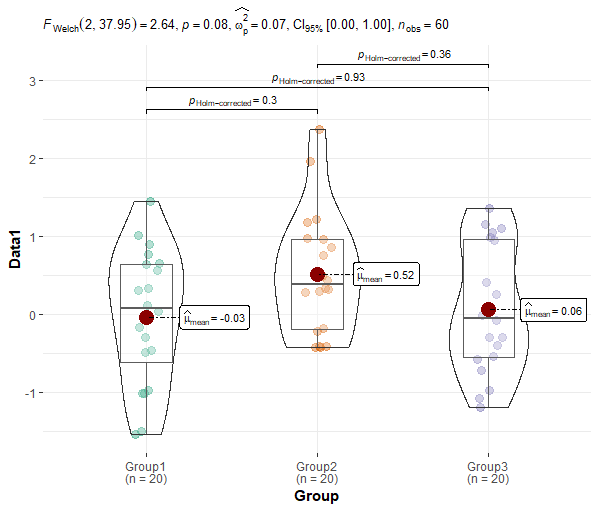
ggbetweenstats(data = TestData, x = Group, y = Data1,
               pairwise.comparisons = TRUE,
               pairwise.annotation = "p.value",
               pairwise.display = "all",
               plot.type = "boxviolin", messages = FALSE,
               k = 2, p.adjust.method = "holm")

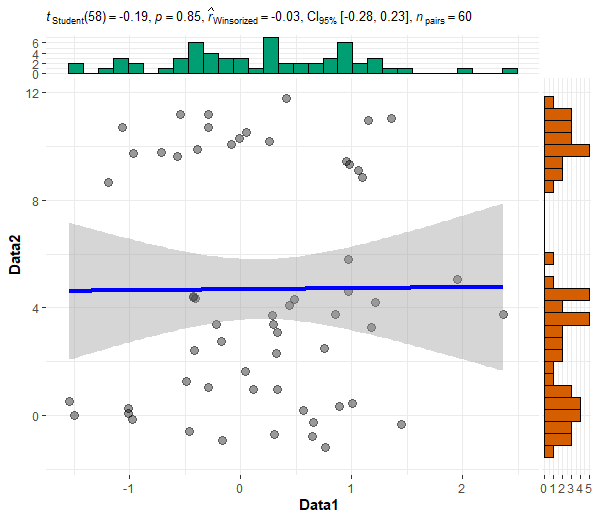
#Generate scatterplots with statistics: ggscatterstats command
#Specify how to calculate correlations:type; "parametric", "pearson", "robust", "bayes"
ggscatterstats(data = TestData, x = Data1, y = Data2,
               type = "robust", messages = FALSE,
               centrality.para = "median")

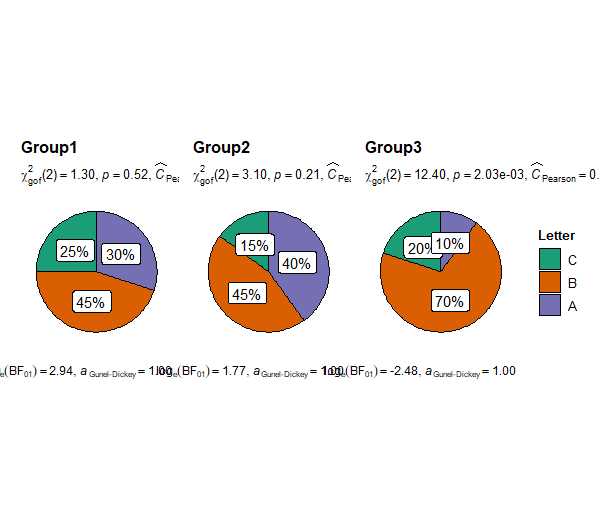
#Create a pie chart of categorical variables: grouped_ggpiestats command
#Specify categorical variables: main option
#Specify grouping indicators: grouping.var option
#Label content: slice.label option; "percentage", "counts", "both"
grouped_ggpiestats(data = TestData, x = Letter, main = Letter,
                   grouping.var = Group, slice.label = "both")
Output Example
・ggbetweenstats command
・ggscatterstats command
・grouped_ggpiestats command
I hope this makes your analysis a little easier !!

スポンサーリンク