からだにいいもの
 Analysis in R: “bluepRint” package for plotting various ggplot objects
This is an introduction to a package that allows you to easily plot multiple ggplot2 objects. It would be useful for routine repetitive output, as long as the plot area and plot style are specified.
Package version is 0.0.0.9000. Checked with R version 4.2.2.
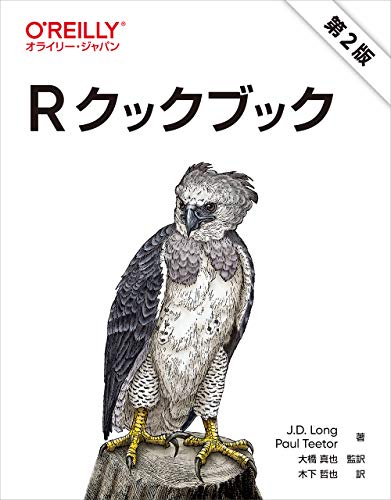
<おすすめのRに関する書籍です>

R言語徹底解説 | Hadley Wickham, 石田基広, 市川太祐, 高柳慎一, 福島真太朗
Advanced Rの邦訳。オブジェクトの仕組みや関数型プログラミングなど、Rの言語仕様を深掘りする。
Install Package
Run the following command.
#Install Package
install.packages("devtools")
devtools::install_github("zaczap/bluepRint")
スポンサーリンク
Example
See the command and package help for details.
#Loading the library
library("bluepRint")

###Creating Data#####
n <- 30
TestData <- data.frame(Group = sample(paste0("Group", 1:5), n, replace = TRUE),
                       Data1 = rnorm(n),
                       Data2 = rnorm(n) + rnorm(n) + rnorm(n),
                       Data3 = sample(0:1, n, replace = TRUE),
                       Data4 = sample(LETTERS[1:26], n, replace = TRUE))
#######

###Create ggplot2 object#####
#BoxPlot
BoxPlot <- qplot(data = TestData, x = Group, y = Data1, fill = Group, geom = "boxplot")
#ScatterPlot
PointPlot <- qplot(data = TestData, x = Data2, y = Data1, color = Group, geom = "point") +
  ggtitle("TEST")
#BarChart
BarPlot <- qplot(data = TestData, x = Data4, fill = Data4, geom = "bar") +
  guides(fill = "none")
#Split BarChart by Group
FacetBarPlot <- qplot(data = TestData, x = Data4, fill = Data4, geom = "bar") +
  facet_wrap(~Group, nrow = 1) + guides(fill = "none")
########

#Place graphs side by side:blueprint command
#Layout style:layout option;"line","square","left_feature"
#Assign A, B, C, D graph labels:label option
#2 plots side by side
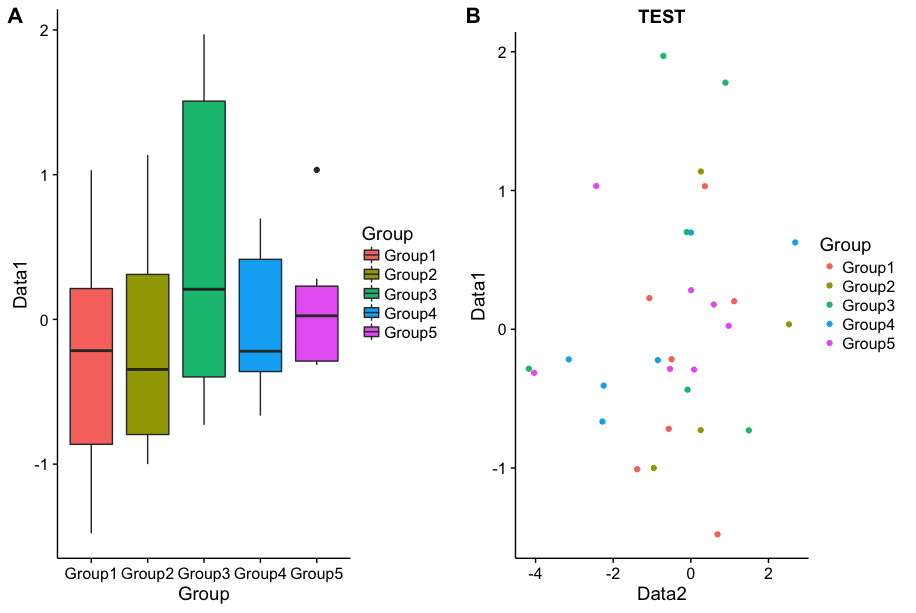
blueprint(layout = "line", BoxPlot, PointPlot, label = TRUE)
#3 plots side by side
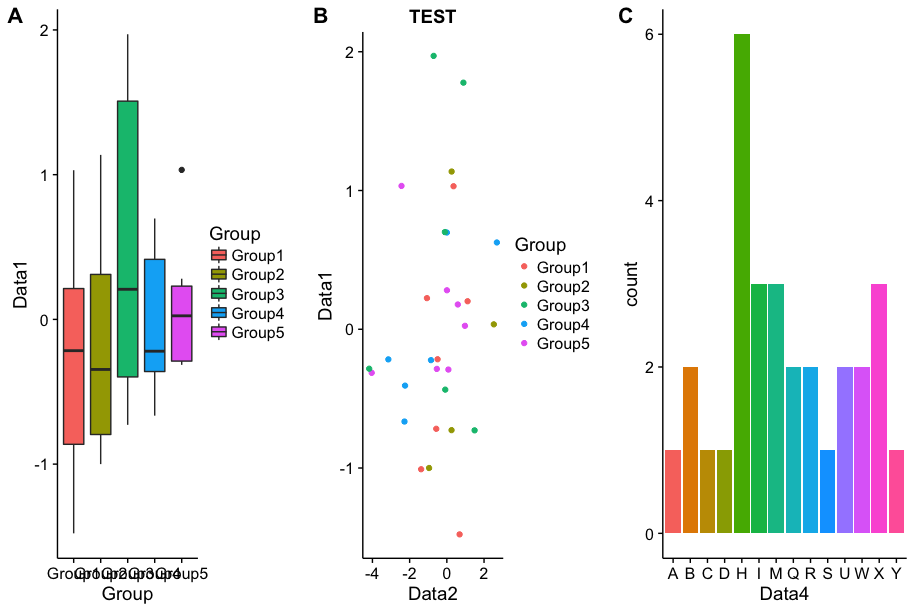
blueprint(layout = "line", BoxPlot, PointPlot, BarPlot, label = TRUE)
#2*2 plot
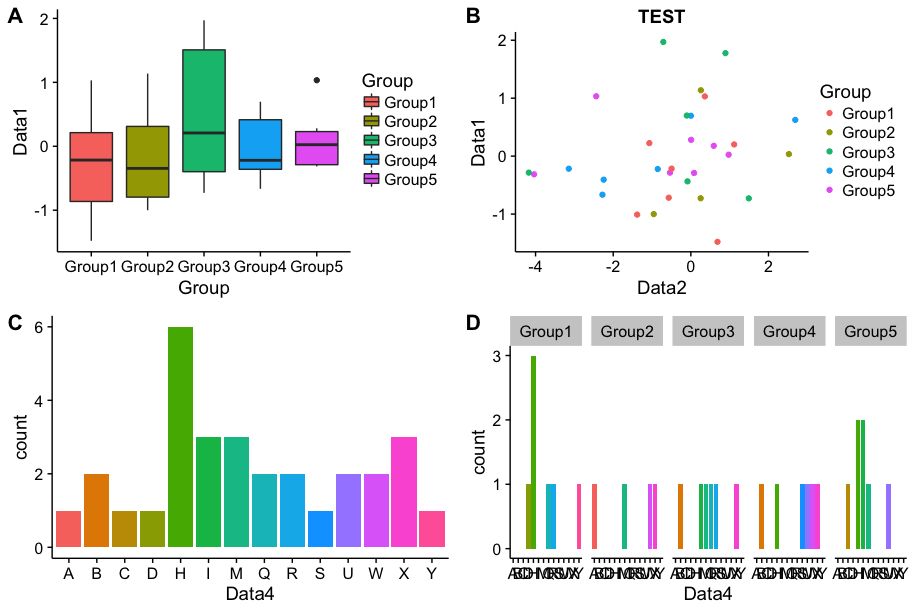
blueprint(layout = "square", BoxPlot, PointPlot, BarPlot, FacetBarPlot, label = TRUE)
#One large plot on the left, two plotted up and down on the right
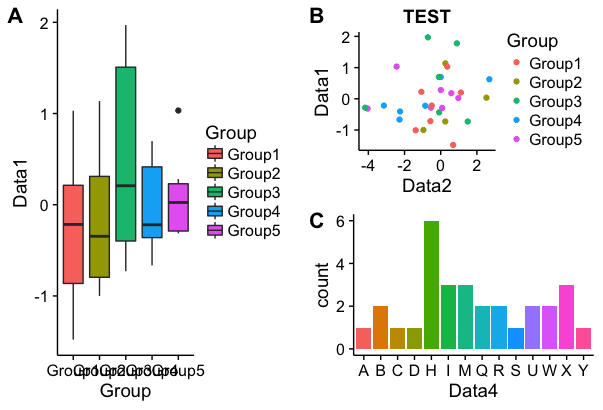
blueprint(layout = "left_feature", BoxPlot, PointPlot, BarPlot, label = TRUE)
Output Example
・2 plots side by side
・3 plots side by side
・2*2 plot
・One large plot on the left, two plotted up and down on the right
I hope this makes your analysis a little easier !!
スポンサーリンク