からだにいいもの
 Analysis in R: Simple!! Plotting marginal distributions. ggplot2 extension “ggExtra” package
Plotting marginal distributions on a graph is quite time-consuming, so we introduce the “ggExtra package” which allows you to easily plot marginal distributions with the ggplot2 package.
Package version is 0.10.0.

Install Package
Run the following command.。
#Install Package
install.packages("ggExtra")
スポンサーリンク
Execute command
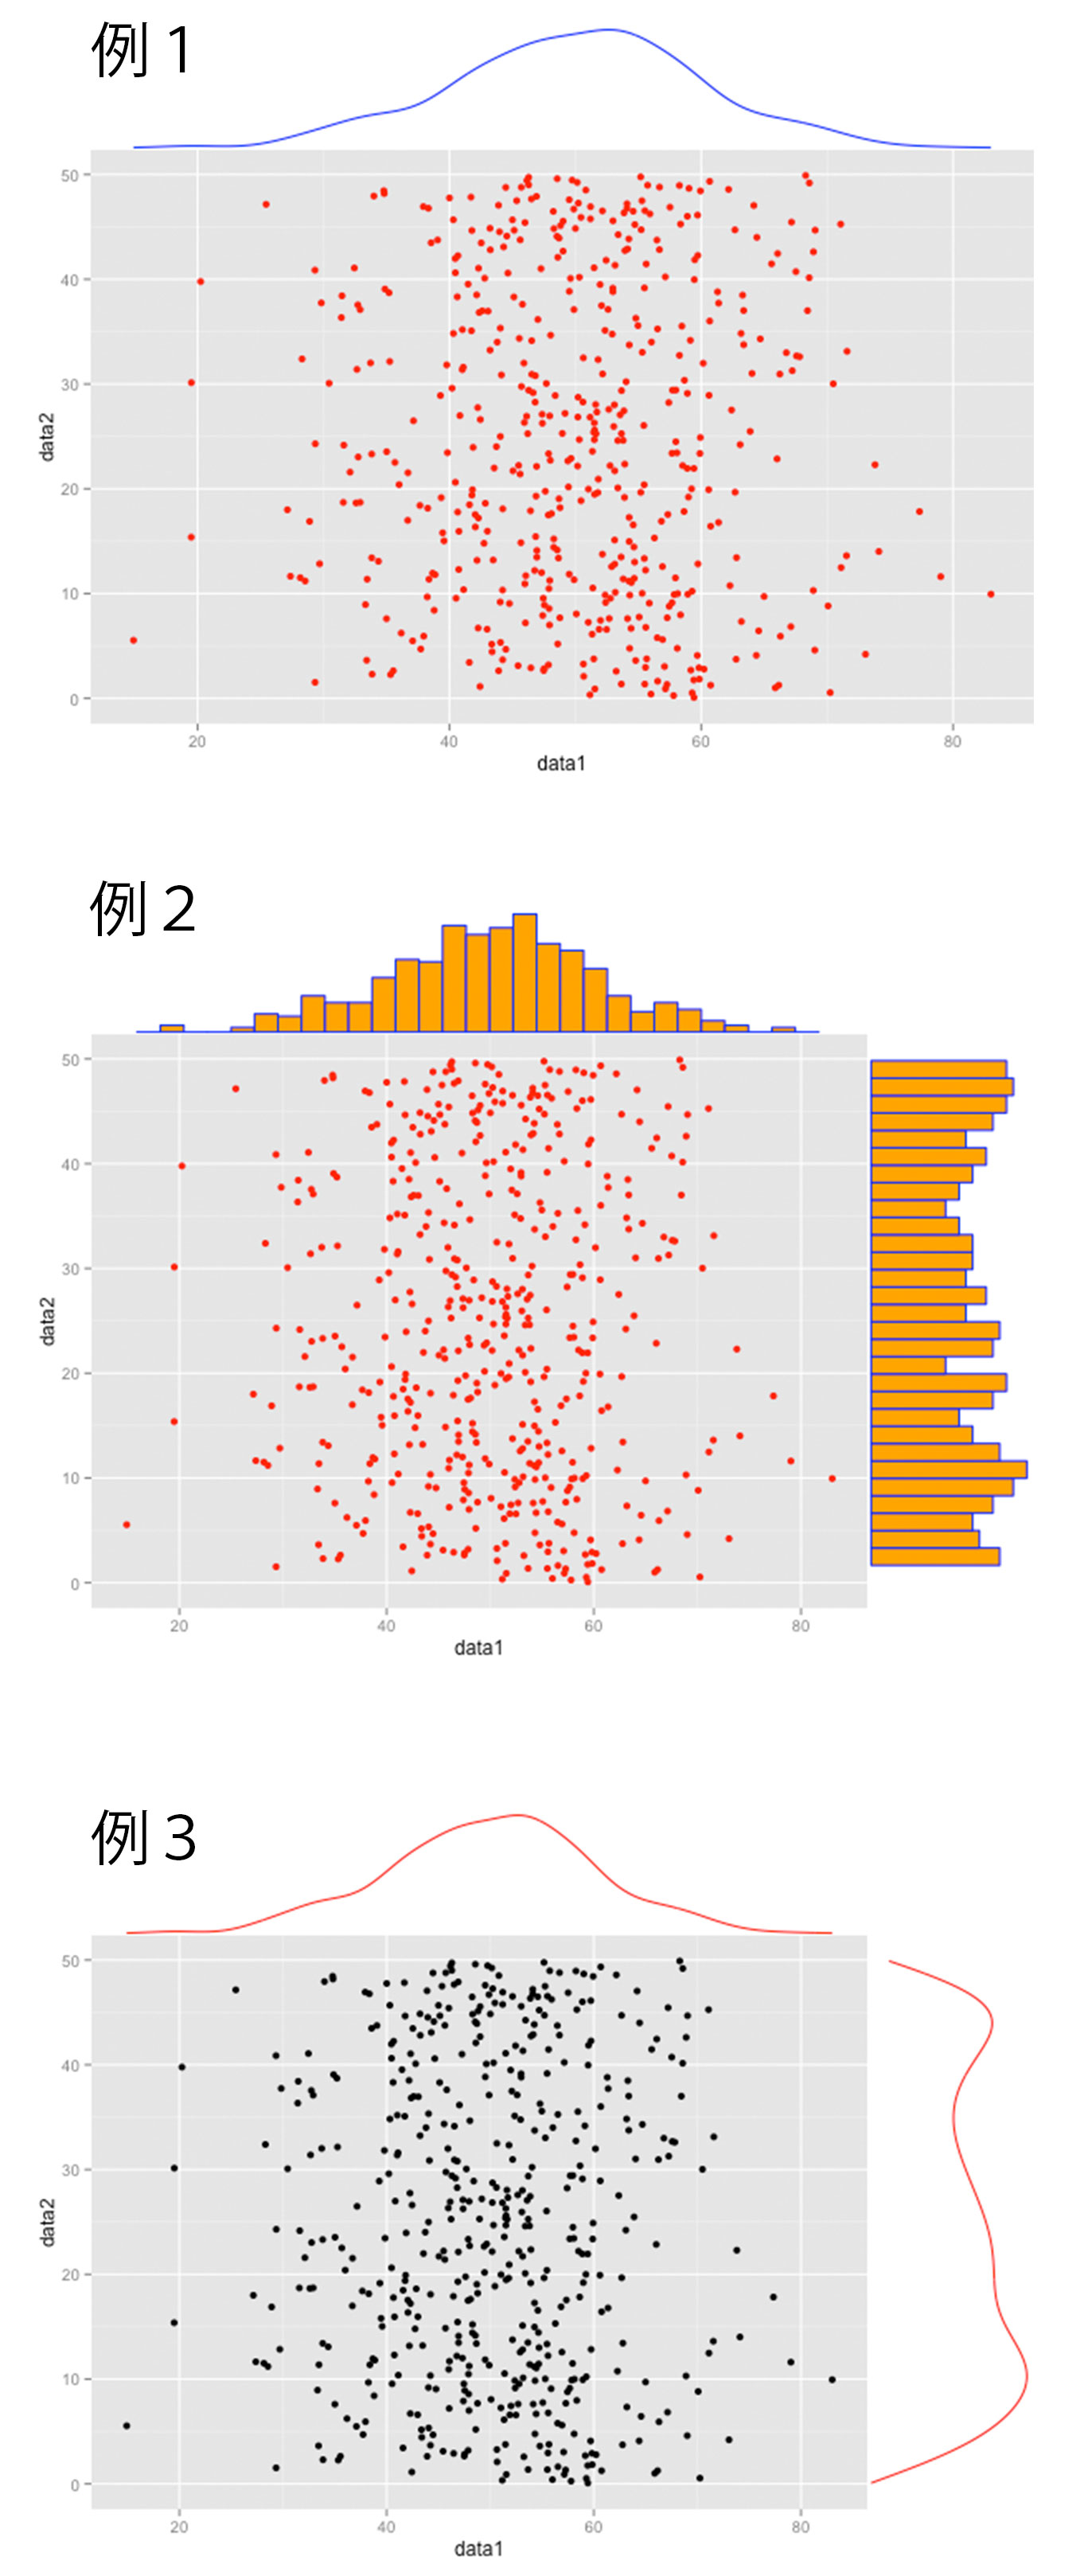
周囲の分布についての情報を持つ便利なプロットが散布図です。以下のコマンドは散布図の例です。詳細はコメントを参照してください。
#Loading the library
library("ggExtra")
library("ggplot2")

#Creating Data Examples
set.seed(50)
TestData <- data.frame(data1 = rnorm(500, 50, 10), data2 = runif(500, 0, 50))

#Example 1: A dashed line on the plot indicates the peripheral distribution with respect to the x-axis.
PointPlot <- ggplot(TestData, aes(x = data1, y = data2)) +
  geom_point(color = "red")
ggMarginal(PointPlot, margins = "x")

#Example 2: Histograms for plots with marginal distributions
ggMarginal(PointPlot, margins = "both", size = 5,
           type = "histogram")

#Example 3: Direct Plot
ggMarginal(data = TestData, x = "data1", y = "data2")
Output Examples
I hope this makes your analysis a little easier !!

スポンサーリンク